For Young And Old: How Age And Experience Affect AFL Results
Last updated: Jul 27, 2020, 3:29AM | Published: Jul 27, 2020, 1:10AM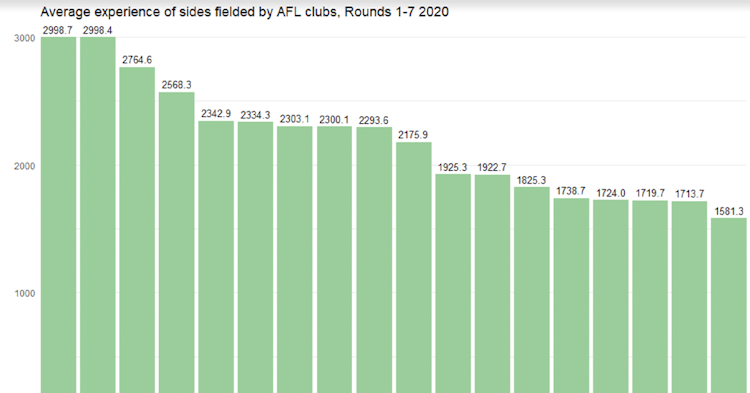
Statistics on the average age and experience of AFL sides are often quoted in the media, but do they have any real relevance to the game? And are there better ways to measure them? Today, we’ll answer both of these questions.
The importance of age and experience for AFL sides is the kind of topic that it’s easy to dismiss with an anecdote, if you so desire.
For a recent example, one could point out that just this weekend Sydney defeated a Hawthorn team that was, on average, 2+ years and 45+ games more experienced.
This is an extreme example of a common occurrence – younger and less experienced teams regularly best older, more experienced opponents in the AFL.
But, the numbers still suggest that age and experience give AFL teams an edge.
 The above scatter plot shows the interaction between the experience differential of home sides and their eventual scoreboard result over the last five years.
What you might notice immediately is that the data is well spread out – clearly, there’s a lot of other factors beyond team experience that go into determining the outcome of an AFL game.
Be that as it may, there is a linear trend, albeit a weak one. Linear regression suggests the experience differential is responsible for about 12% of the variation in AFL results.
That might not sound like a lot - it might not sound like anything at all. To put it a different way, 62.7% of matches in this time period were won by the team with a higher average experience.
RELATED: Size Matters: The Types Of Forwards Scoring For And Against Your Club
Experience again proves the better measure – winning 61% of matches, however using pure experience limits the risk of overvaluing players who entered the league at a mature age.
Are averages the best way to measure the age and experience of AFL sides, though?
Some would argue that the median may give us a better overall picture.
The median plucks out the middle value – in the case of an AFL 22, the value in between the 11th and 12th ranked players – when each player is lined up in order of the relevant stat, in this case, age or experience.
An average might be skewed by the presence of an unusually old or unusually young player in the data – not so the median.
While the median does have that advantage, the numbers do not suggest that it provides a better predictor of match outcome for either of these measures.
Experience again proves the better measure – winning 61% of matches – but that’s a step backwards rather than forwards when compared to using averages.
RELATED: Understanding how Clearances Shape the Results of AFL Games
When considering the median, another idea occurred to me – what about measuring the age or experience of those players who occupy the position between a team’s top or bottom six, and the rest of the 22?
That led to some more intriguing results.
For example, the sixth-most experienced player in an AFL 22 is a predictor that gets the win 62.3% of the time – nearly as good as average experience, but from much less information.
On the other end of the scale, the age of the sixth-youngest player in the 22 is a solid predictor too – performing with roughly the same accuracy as the overall average age.
I considered one other possibility. Does having more players in their prime make a team more likely to win? For the sake of the question, the prime age was defined as being anywhere between 24 and 29.
Again, there is a relationship here – 58.5% of teams with more prime-age players won their matches in the time period measured. But it’s not an improvement on the other measurements we’ve looked at.
What’s clear is that there’s a number of different ways we can look to understand the age and experience of an AFL side, and each is capable of providing nuance that the others may not.
However, when it comes to making predictions about the outcomes of matches, those most commonly used measures – the average age and games experience - are as good or better than the rest.
With that in mind, how are clubs tracking for these stats in 2020? A few clubs in the chart below might surprise you, but most don’t.

Recent premiership winners or contenders like Richmond, West Coast, Collingwood, GWS, Geelong and Hawthorn all feature in the top eight most experienced sides of the year on average so far.
To see Carlton up there is perhaps a little more surprising, but it’s worth noting that Kade Simpsonand Eddie Betts account for more than 600 games worth of experience each week.
Meanwhile, the bottom six is a mix of teams who are struggling as you’d expect – Adelaide, Sydney and Fremantle – and those who are thriving despite their inexperience, like St Kilda, Gold Coast and the Bulldogs.
RELATED: How Different Weather Conditions Affect AFL Performance
I’ll leave you with one last very quirky stat on the demographics topic while we’re on it: Hawthorn might have fielded the oldest side in AFL history earlier this year, but the matter is open to some interpretation.
In Round 2 versus Geelong, the Hawks put on the field a side that was, on average, 10,303 days old – beating out Richmond in Round 15, 1923 by 0.17 of a day.
But, if measured by years-and-days, the Tigers come out slightly older. Why? The explanation lies in a quirk of the calendar, in which 2000 was a leap year, but 1900 wasn’t.
That means every Hawk born on Feb 28, 2000 or earlier who took to the field that night had lived a day longer in the same number of years as the Richmond players in that 1923 side born on or before the same date in 1900.
So, either side could be considered the oldest in VFL/AFL history, depending on how you choose to measure it.
Who ever said footy had nothing to do with quantum physics?
Did you enjoy this article? Join our free mailing list to get the best content delivered straight to your inbox, or join the conversation by leaving a comment below or on the Stats Insider Twitter or Facebook page.