How Different Weather Conditions Affect AFL Performance
Last updated: Jul 8, 2020, 3:08AM | Published: Jul 8, 2020, 2:09AM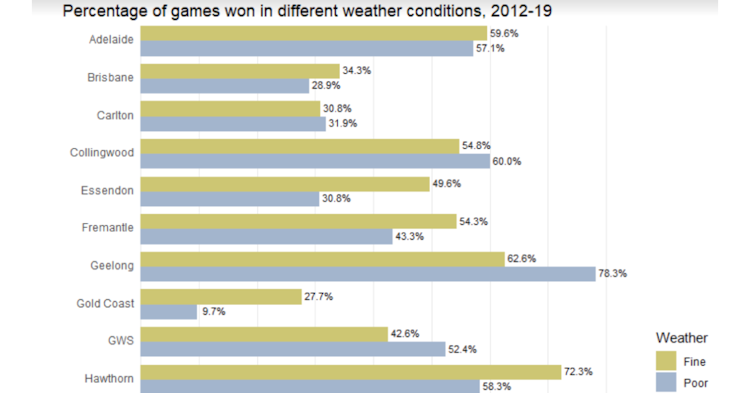
Australian Rules Football is a sport that has famously been played in almost any weather condition over the years, from heavy rain in Cairns to snow in Canberra.
How does the weather change a game of footy?
Well, a recent opening up of data resources makes some good analysis possible, and today we'll work specifically with data from 2012-2019, for the moment setting aside some of the more unusual numbers from the 2020 season.
This data provides ten different weather categories, ranging from sunny and overcast, to thunderstorms and rainy-windy. For ease of analysis, we've grouped nine of those categories into two – ‘fine’ weather and ‘poor’ weather.
The remaining category has been left out of this study – ‘Roof Closed’, which was observed only 19 times in the period we’re examining. Altogether, roughly one in five matches (335 out of 1625) has been played in poor weather over this period of time.
RELATED: Be Sure to check out Stats Insider's updated Player Ratings
THE KEY STATS
So, how does poor weather affect the key stats of the game? For the most part, the differences between fine and poor weather follow a straightforward logic.
177 points is the average combined score in fine weather, but this drops to 164 points when the weather is poor.
This is partly due to less shots on goal – about two less per game – but also worse accuracy, which drops from 49.3% to 47.3%.
Poor weather has a clear effect on how teams win and move the ball. About eight more contested possessions are recorded, and 10 less uncontested, with a similar drop in the number of marks per game.
Ultimately, the ball travels about 110 metres less per game, and a match sees 25 more pressure acts than typically occur in fine weather.
Kicking efficiency is more noticeably impacted than handballing efficiency. Perhaps surprisingly, teams don’t tend to change their kick-to-handball ratio in poorer conditions.
RELATED: Tried the AFL Shot Charting Explorer yet?
WET WEATHER SPECIALISTS
In the 2012-2019 time period, there are 559 AFL players who played at least 10 games in both fine and poor conditions.
How did the conditions affect their performance? I’ve chosen to look at this through the lens of AFLCA coaches votes.
For many the difference is negligible, but for some players at either end of the scale, a clear trend emerges.
 In the chart above you can see the 13 players who averaged at least one full AFLCA vote more
in poor weather than they did fine weather over the time period.
In the chart above you can see the 13 players who averaged at least one full AFLCA vote more
in poor weather than they did fine weather over the time period.
Lachie Whitfield’s difference of +2.15 votes in poor weather is the biggest in the game, while Dangerfield’s average of 5.35 votes in poor weather games is the highest of any player in the comp, the next best being Nat Fyfe’s 3.9.
Many of the players at the other end of the scale are recent retirees. Jobe Watson’s -2.32 votes in poor weather was the worst differential of any player over the time period, Clayton Oliver’s -1.33 votes the worst of any current player.
RELATED: Beyond the Goals: How AFL Key Forwards Compare Across Non-Traditional Metrics
THE GREAT LEVELLER
Poor weather means more upset results..... Or does it?
We’ve established that poor weather means less scoring and worse skills, but does it level the playing field and give underdogs a better chance at the win?
It's a decent theory, however the data doesn’t bear it out.
Comparing the results of games to the pre-match betting odds, the favourites were actually more likely to get the job done in poor weather than fine.
Not by any great stretch mind you – over this time period, the favourites won in poor weather 75.6% of the time, and in fine weather 71.8% of the time.
So much for that theory – there are probably individual games you could point to where it might be considered a factor, but it doesn’t exist as a broad trend across all poor weather games.
Instead, perhaps the numbers suggest that sides with more experience and quality - as is generally the position of betting favourites – do a better job of adapting to poor conditions.
WET WEATHER WINNERS
 We’ve already seen that some players perform better or worse in different conditions,
and there’s some similar, even more pronounced trends on a team level as well.
We’ve already seen that some players perform better or worse in different conditions,
and there’s some similar, even more pronounced trends on a team level as well.
St Kilda appear to be the competition’s best poor-weather performers – being 1.57 times more like to win a match if played in poor conditions than in fine.
At the other end of the scale, Gold Coast are by far the most likely to perform better in good weather – 2.86 times more likely to get the win.
Part of that is perhaps skewed by Gold Coast’s low overall winning percentage, and it is Essendon who have the biggest drop (from 49.6% to 30.8%) when going from fine weather to poor.
Still, it’s amusing to consider the fact that Gold Coast may be so buoyed by the presence of their own mascot in the sky as to perform significantly better on field.
While AFL club songs tend to be unreasonably boastful, Richmond’s claim that in any weather they will do it with a grin is backed up by the fact they win 74.4% of matches played in poor conditions.
It’s worth noting there’s potentially a chicken-and-egg debate to be had around how the weather affects player and club performances.
Dangerfield and Geelong are noted poor-weather performers, while Watson and Essendon are not – does one cause the other, and if so, in what direction? That remains up for debate.
RELATED: Who's the new flag favourite according to the Stats Insider Futures Model?
IN CLOSING...
Overall, there are some clear trends we can observe when the weather turns poor: Scoring and ball movement suffer, as do some players and teams, while others thrive.
More nuance could potentially be provided if there was a greater balance between different AFL weather scenarios. Most teams have only played 30-45 games in poor weather over the eight years of football observed here.
Even then, there are many different scenarios which constitute poor weather, most occurring far too rarely for us to be confident of any trends they might suggest.
We could not for example say that GWS are a remarkably bad team in the snow or Hawthorn an outstandingly good one based on last year’s match alone – though it’s certainly amusing to ponder doing so.
This article is provided by a guest writer. All stats and figures contained within (in this case courtesy of the fitzRoy R package) were provided by the author; and do not constitute Stats Insider data. All opinions are that of the writer.
Did you enjoy this article? Join our free mailing list to get the best content delivered straight to your inbox, or join the conversation by leaving a comment below or on the Stats Insider Twitter or Facebook page.