Charting The AFL Premiership Clock: How Far Is Your Club From Its Next Flag?
Last updated: Sep 9, 2020, 5:19AM | Published: Sep 9, 2020, 10:32PM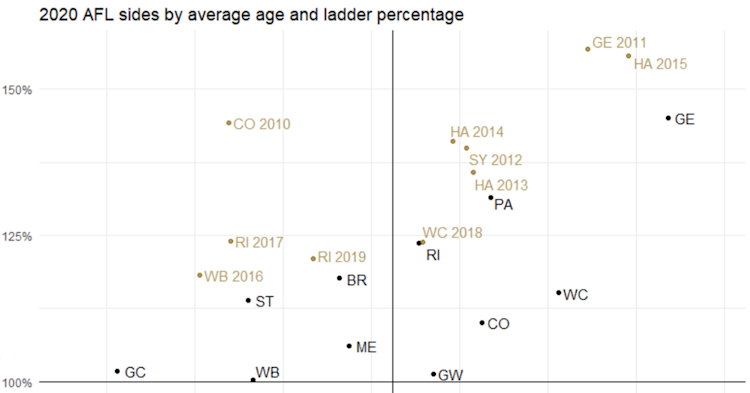
The phrase ‘premiership clock’ gets a good workout in footy media circles as a way of discussing just how near or far an AFL team is from premiership contention. But is this something we can hope to measure using stats and data?
There’s a lot of numbers that could help to illustrate just where an AFL team is placed with regards to the premiership – but let’s keep it simple, and boil it down to two things in particular.
The first is the age profile of an AFL side. There’s no such thing as being too young or too old to win a flag, but history and logic tell us that mature sides are a better bet – and that older teams might not have much time left.
The second is, simply, on-field performance. There’s no point having the perfect balance of age and experience if you aren’t also playing good footy.

The above graph looks to measure both of these key factors.
From left to right 2020’s AFL sides are ordered from youngest to oldest, and from bottom to top they are measure by their percentage across the season so far.
By drawing two lines – one representing a perfectly even 100% percentage, and the other showing the competition average age for the season so far – we can divide the AFL’s 18 clubs into four groups, determined by what sides of those lines they sit on.
RELATED: Check Out Stats Insider's Updated Futures Projections
Let’s start with the bottom right – pretty much the worst place to be. These are the sides who are both older than average but also performing worse on field than average. As you’d expect, it’s an area most clubs look to avoid like the plague.
Only three teams are located here currently – North Melbourne, Carlton, and Hawthorn. The Blues and the Roos are on the fringe of fluctuating into more pleasant zones, but the Hawks are both one of 2020’s worst teams on the field and the oldest side in the competition.
Moving to the bottom left, it’s no surprise to see rebuilding sides Adelaide, Sydney and Fremantle all fitting in the category of younger than average, and worse on field than average. While it isn’t the most fun place to be, teams in this zone can feel optimistic that they’ll improve as they mature.
Perhaps a more surprising team to spot in this quadrant is Essendon, who despite some notable mature acquisitions are still a younger (and worse) side than the average in 2020. Injuries have probably had some impact on both these measures.
Moving up to the top left we find the clubs who are younger than average, but boasting a percentage above 100. This is an exciting space to be, as it suggests there’s further maturity and improvement to come for sides who are already competitive or better.
Brisbane, St Kilda, Melbourne and the Bulldogs are all sides we might have expected to feature here at the start of the year, though the Dogs are only scraping in by the seat of their pants, and the Dees, despite a promising position, remain much maligned.
Gold Coast are perhaps a more surprising inclusion – the Suns sit 14th on the ladder but have a percentage above 100, the only team in the bottom eight who can boast that. Given they’ve been 2020’s youngest side to date, that’s very promising.
It’s a bit reminiscent, in fact, of Brisbane’s 2018 season where the Lions managed only five wins and finished in the bottom four, but stood head and shoulders above the teams around them in terms of percentage. Perhaps 2021 will be a breakout year for Gold Coast, as 2019 was for their cross-town rivals.
RELATED: Inside Brisbane’s Woeful Goalkicking: Who’s To Blame?
Progress isn’t always linear and perhaps not all of these sides will develop into future premiership contenders – but they can certainly hope to. It’s an exciting place to be.
Finally, the top right – this is where the heavyweights of the competition sit. Mature sides who are older than the AFL average, but also boasting a percentage above 100. Unsurprisingly, it’s the home of many premiership contenders.
Geelong, Port Adelaide, Richmond and West Coast are the four sides most firmly entrenched here, and each finds themselves deep in the flag race. The other two teams in this quadrant, Collingwood and GWS, have both played in grand finals in the last two years.
But just how strongly does a team’s position on this graph point towards a premiership? To consider that, we need a little more data.

This version of the graph adds in the positions of the AFL’s last ten premiership teams, separated from the rest by the colour gold. They help to illustrate just where a team needs to be if they want to contend for the flag.
Five teams in particular are close to sharing a position with the premiership sides of the last decade: Geelong, Port Adelaide, Richmond, Brisbane, and perhaps surprisingly, St Kilda.
The Cats aren’t too far off the heights we saw from their own 2011 flag side or that of Hawthorn in 2015, both sides who were ageing but also dominant. If they salute, the Cats would be the oldest premier of the last decade.
Port Adelaide are in good company hanging around the premiership sides of 2012-14, as are Richmond near West Coast’s 2018 triumph. The Lions find themselves in a similar spot to Richmond of 2019 – though the position of that marker is shaped somewhat by the Tigers’ injury crisis in the first half of that year.
St Kilda find themselves most closely located to two of the most unexpected premiers of recent years – the Western Bulldogs in 2016, and Richmond in 2017. Suffice to say that if the Saints – who are not yet even assured of finals – were to win the flag, it would be no less shocking.
Most footy watchers would agree that there are five sides in the flag race but would likely sub in West Coast for the Saints – however, the graph suggests the Eagles have some work to do to make up the gap on other teams.
The Stats Insider futures model currently rate them an 11.2% chance for the flag – good enough to be ahead of the Saints, but some distance behind Brisbane, Geelong, Richmond and Port Adelaide who all sit between 21% and 16%.
Who will be adding their name to the chart in gold when the curtain is drawn on season 2020? And what kind of progress will the league’s rebuilding or up-and-coming sides make in the years to come? We look forward to finding out.
Did you enjoy this article? Join our free mailing list to get the best content delivered straight to your inbox, or join the conversation by leaving a comment below or on the Stats Insider Twitter or Facebook page.