Understanding how Clearances Shape the Results of AFL Games
Last updated: Jul 13, 2020, 11:35PM | Published: Jul 13, 2020, 12:45AM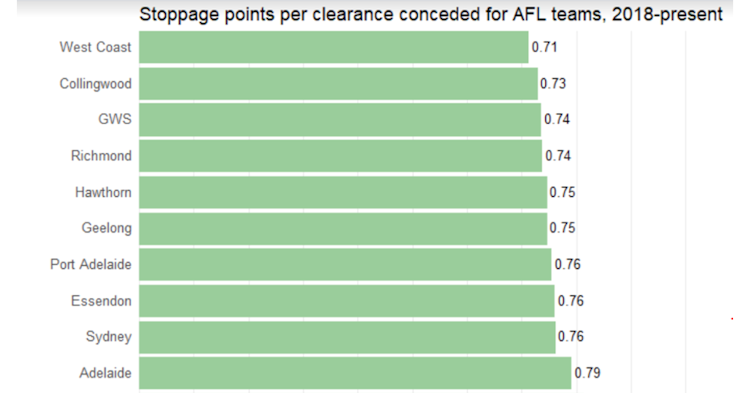
Of the last ten teams to win the AFL Grand Final, only five have boasted a positive clearance differential across their respective seasons.
Geelong 2011, Sydney 2012, Hawthorn 2013, and Richmond in both 2017 and 2019, all finished their years with less clearances on average than their opponents each week – and a premiership in hand.
Most still came close to breaking even, but not the Tigers of 2019. They were ranked 16th for clearance differential last year, averaging 4.7 less per game than their opponents.
So, do clearances still matter in the AFL?
Despite these recent trends, the answer is still very much yes.
 The scatterplot above looks to draw a relationship from the home side’s clearance differential to the final margin of the game, for each match from 2018 to the present.
RELATED: How Different Weather Conditions Affect AFL Performance
The points on the plot are pretty well spread out, which shows that’s there’s not much in the way of a relationship here. This suggests that – as you’d expect - there’s a lot of other factors which influence the outcomes of an AFL game.
Although it’s not easy to see in the chart, these two stats aren’t without some kind of relationship. Over the time period we’re looking at here, the side with more clearances goes on to win about 58% of the time.
This is a number that has fluctuated up and down, from season to season, since clearances began to be recorded as a stat in 1998. It has never dropped lower than 50%, and never risen higher than 64%.
There’s no pattern to suggest clearances have risen or fallen in importance in a linear way over the years. If anything, modern-day matches have been perhaps a little more likely to go in favour of the side winning the clearances than those played 20 years ago.
That alone is enough to say yes – regardless of the Tigers’ winning ways, clearances still matter. But, we can do better.
 Clearances are only one part of the story – what really matters is what happens after them, and whether a team can convert their ability to win the ball into points on the scoreboard.
RELATED: Beyond the Goals: How AFL Key Forwards Compare Across Non-Traditional Metrics
From 2018-present, AFL teams can attribute around 37% of their total scores to points scored from stoppages.
For sake of comparison - around 59% of points scored over the same time period come from intercepts. Scoring from stoppages may not have as big a say in the typical game, but you’ve got to be good at both.
The above chart shows each team’s ability over the period 2018-present to score from the clearances they won – not in total points per game, but per clearance. It is their points from stoppages divided by their number of clearances.
This metric ignores the raw ability of a team to win clearances, and instead measures whether or not they turn it into points on the scoreboard when they do.
Across the competition there’s a staggered range of values from 0.92 to 0.71- and then the Gold Coast Suns sit a fair distance below everyone else. It’s an area where the Suns have improved markedly in 2020.
It’s notable that the two sides to win premierships in this time period, Richmond and West Coast, only sit at 9th and 11th for this metric.
Underwhelming results. But, how well you score when you win a clearance is only half the battle.
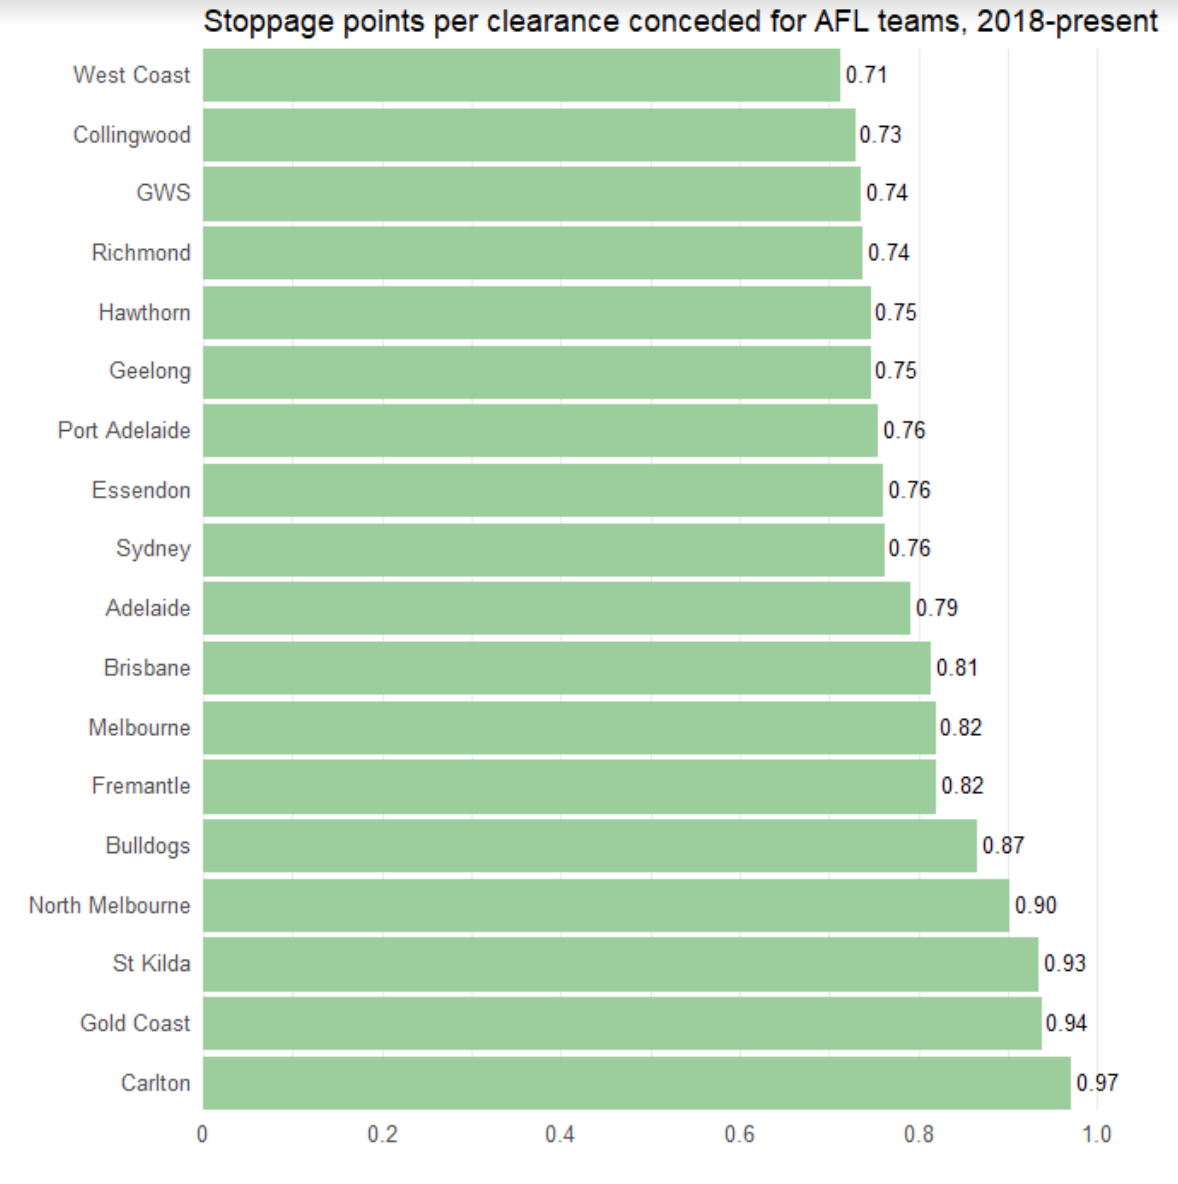 This chart tracks the same metric as the previous one, but flipped on its head. Instead of measuring how well sides score when they win the clearance, it asks how well their opponents do.
We can see that it’s a stat where our recent flag-winners, West Coast and Richmond, show the kind of elite performance you’d expect from successful sides.
The Eagles in this 2018-present time period are the most miserly team in the competition when it comes to defending opposition clearances, restricting them to 0.71 points for a clearance win.
Richmond find themselves in fourth overall by a narrow margin, at 0.73 – and it’s the two other grand finalists of the era, Collingwood and GWS, who round out the top four.
Most teams keep it below 0.82 or so, but there are some blowout figures in the bottom five, with Carlton, conceding almost a full point per opposition clearance, at the bottom of the table.
Overall, this falls more closely in line with how teams performed during the time period we’re looking at - and if we put two and two together, we’ve got a new and better understanding of how clearances win games.
 Like our first plot, this one shows how performance in clearances relate to the final outcome of a game.
However instead of using the home side’s clearance differential, we’re using their stoppage points from clearances differential.
The first plot was very spread out, and the relationship between those two stats hard to discern – but here, we can see a much tighter, more clear linear relationship.
In the matter of who won or didn’t, there’s a big leap forward – 74% of teams who won this stat also won the game.
To put it simply: one clearance is not equal to another.
If you can score more freely from your clearances than you allow your opponent to do from theirs, that matters more than the raw number of how many you win.
What does it mean for season 2020?
Based off a small sample size of the season so far, clearances look to be as important as ever.
64% of teams to win the clearances are going on to win the game in 2020 which would be on par with the highest years on record.
North Melbourne are second in the league for clearance differential, but showing only a middling ability to score from them. Worse, they are 17th for defending clearances won by their opposition.
On the other hand, the always hard to pin down Port Adelaide boast the competition’s best clearance differential (+6.0), and are No.1 for both scoring from and defending clearances.
The Power’s numbers right now are probably unsustainable across the course of a whole season, and benefit from bashing up on some weaker teams in the opening rounds – but even as they inevitably come back, it’s clear they’re tracking well in the premiership race.
Note: The stats on points from stoppages used in this article are recorded as they were published after each game in the Herald Sun.
For a small number of matches these stats were never published, and there is also known to be a small number of typographical errors in the original source data.
Viewed on a broad scale the numbers still produce valuable insights. However, they should not be taken as a perfectly exact record.
Did you enjoy this article? Join our free mailing list to get the best content delivered straight to your inbox, or join the conversation by leaving a comment below or on the Stats Insider Twitter or Facebook page.