AFL: The Best and Worst Kicks for Goal in 2019
Last updated: Aug 7, 2019, 2:27AM | Published: Jul 25, 2019, 2:30AM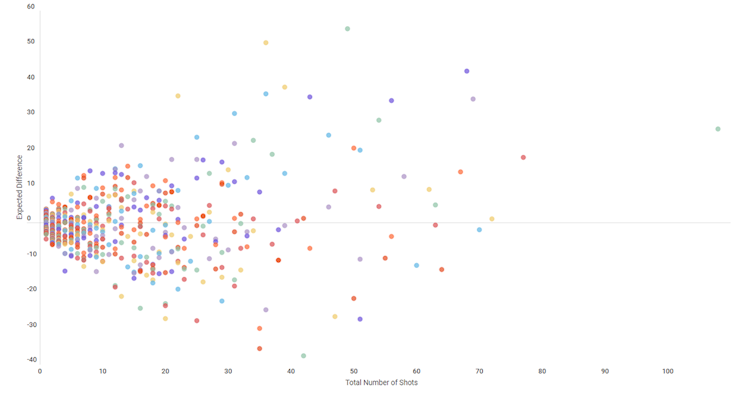
Using the Stats Insider 'expected score' formula, we’ve put together some data for the best and worst kicks for goal in the league.
AFL Shot Charting: Every player, every shot, since Round 1, 2018.
If you’re unfamiliar with how our expected score algorithm works, here’s a quick refresher:
The formula works by taking the league average accuracy from that field position and shot type (general play or set shot) and converting it into our 'Expected Score,' which is essentially the sum of the player's total points from their expected goals and behinds.
'Actual points' is, of course, the sum of the player's actual goals and behinds.
Using this method, we get a better understanding of whether the player is below par, above, or simply average at kicking for goal.
RELATED: AFL Shot Accuracy Explained
So, let's start with the positives.
The table below shows the top 20 players who have most exceeded their expected score.
First off, Gary Ablett Jn. at the ripe old age of 35, is the number #1 player in the league when it comes to capitalising on his shots at goal. He’s kicked an amazing 54.9 points more than would be expected by the 'average player' from the same positions on the ground.
Here is clear vindication for the people that suggested that Ablett could - and should - successfully move forward in the twilight of his career.
See where Gary Ablett has taken his shots on goal in 2019 from:

Also noteworthy in the table below is Essendon's recent match-winner, Anthony McDonald-Tipungwuti. Coming in at #2 with a total differential of 50.9pts above the expected score, it's not hard to see why rival clubs have started to show an interest in the out-of-contract Bomber forward.
One of the more incredible statistics in this positive-differential table is that top-of-the-ladder, Geelong, contain an astonishing four of the top 10, and five of the top 20 players exceeding their expected scores. Ablett, Tom Hawkins, Mitch Duncan, Gryan Miers and Tim Kelly have, in-total, amassed 789 actual points for the Cats in 2019, while their combined expected score is only 602, which means they have scored 187 points above expectation.
<ad>
The big question for Geelong now is, is this sustainable heading into AFL Finals?
AFL Top 20 Best Kicks for Goal in 2019
| Player | Team | Total Shots | Actual Points | SI Expected Points | Difference | |
| 1 | Gary Ablett | GEE | 49 | 187 | 132.1 | 54.9 |
| 2 | Anthony McDonald-Tipungwuti | ESS | 36 | 163 | 112.1 | 50.9 |
| 3 | Tom Hawkins | GEE | 68 | 271 | 228.1 | 42.9 |
| 4 | Jamie Cripps | WCE | 39 | 153 | 114.6 | 38.4 |
| 5 | Sam Reid | SYD | 36 | 160 | 123.5 | 36.5 |
| 6 | Mitch Duncan | GEE | 22 | 102 | 66.1 | 35.9 |
| 7 | Harry Himmelberg | GWS | 43 | 202 | 166.4 | 35.6 |
| 8 | Jack Darling | WCE | 69 | 271 | 236.0 | 35.0 |
| 9 | Taylor Walker | ADE | 56 | 194 | 159.4 | 34.6 |
| 10 | Gryan Miers | GEE | 31 | 122 | 91.0 | 31.0 |
| 11 | Michael Walters | FRE | 54 | 203 | 174.0 | 29.0 |
| 12 | Jeremy Cameron | GWS | 108 | 361 | 334.5 | 26.5 |
| 13 | Lance Franklin | SYD | 46 | 154 | 129.2 | 24.8 |
| 14 | Nick Larkey | NM | 25 | 118 | 93.8 | 24.2 |
| 15 | Cameron Zurhaar | NM | 34 | 135 | 111.8 | 23.2 |
| 16 | Tim Kelly | GEE | 31 | 107 | 84.6 | 22.4 |
| 17 | Jarrod Cameron | WCE | 13 | 62 | 40.1 | 21.9 |
| 18 | Jeremy Finlayson | GWS | 50 | 199 | 177.9 | 21.1 |
| 19 | Tim Membrey | STK | 51 | 204 | 183.4 | 20.6 |
| 20 | Peter Wright | GCS | 37 | 127 | 107.6 | 19.4 |
Now, for the bad news.
The below table shows the worst shots for goal in 2019 - the players who have the biggest negative differential between their expected score, and their actual output.
It’ll come as no surprise to Bulldog fans to see club champ Marcus Bontempelli top the list of shame. Coming in at a massively negative 37.7pts, he owes the Dogs just a touch over 6 goals this season, based on what our expectation of what the 'average player' would kick from the same position as Bontempelli's shots for goal.
Incredibly, he’s still having a stand-out season and finds himself amongst the favourites for the 2019 Brownlow Medal.

To make that leap into the category of the absolute elite players, he’ll have to make more of his opportunities in front of the big sticks.
Here are the 20 players with the worst expected score differential so far in 2019.
AFL Top 20 Worst Kicks for Goal in 2019
| Player | Team | Total Shots | Actual Points | SI Expected Points | Difference | |
| 1 | Marcus Bontempelli | WB | 42 | 93 | 130.7 | -37.7 |
| 2 | Will Hayward | SYD | 35 | 88 | 123.6 | -35.6 |
| 3 | Dean Kent | STK | 35 | 84 | 114.0 | -30.0 |
| 4 | Jordan Clark | GEE | 25 | 56 | 83.7 | -27.7 |
| 5 | Jaidyn Stephenson | COL | 51 | 137 | 164.3 | -27.3 |
| 6 | Jack Sinclair | STK | 20 | 32 | 59.1 | -27.1 |
| 7 | Liam Ryan | WCE | 47 | 116 | 142.6 | -26.6 |
| 8 | Sam Powell-Pepper | PA | 36 | 69 | 93.6 | -24.6 |
| 9 | Brayden Fiorini | GCS | 16 | 18 | 42.3 | -24.3 |
| 10 | Will Setterfield | CAR | 20 | 40 | 63.4 | -23.4 |
| 11 | Paul Puopolo | HAW | 20 | 48 | 71.0 | -23.0 |
| 12 | Justin Westhoff | PA | 29 | 72 | 94.2 | -22.2 |
| 13 | Aaron Naughton | WB | 50 | 157 | 178.5 | -21.5 |
| 14 | Brandan Parfitt | GEE | 13 | 22 | 42.9 | -20.9 |
| 15 | Jayden Laverde | ESS | 22 | 59 | 77.8 | -18.8 |
| 16 | Max Gawn | MEL | 12 | 24 | 42.2 | -18.2 |
| 17 | James Harmes | MEL | 31 | 76 | 94.0 | -18.0 |
| 18 | Andrew Brayshaw | FRE | 12 | 24 | 41.8 | -17.8 |
| 19 | Ben King | GCS | 18 | 42 | 59.1 | -17.1 |
| 20 | Shaun McKernan | ESS | 26 | 69 | 85.8 | -16.8 |
Lastly, we present the best sharp-shooters and the biggest 'shank' culprits at each club.
Best Kicks for Goal at Each AFL Club
| Team | Player | Actual Points | SI Expected Points | Difference | |
| ADE | Taylor Walker | 194 | 159.4 | 34.6 | |
| BL | Mitch Robinson | 76 | 58.1 | 17.9 | |
| CAR | Mitch McGovern | 109 | 91.2 | 17.8 | |
| COL | Josh Thomas | 81 | 68.4 | 12.6 | |
| ESS | Anthony McDonald-Tipungwuti | 163 | 112.1 | 50.9 | |
| FRE | Michael Walters | 203 | 174.0 | 29.0 | |
| GCS | Peter Wright | 127 | 107.6 | 19.4 | |
| GEE | Gary Ablett | 187 | 132.1 | 54.9 | |
| GWS | Harry Himmelberg | 202 | 166.4 | 35.6 | |
| HAW | Ricky Henderson | 65 | 48.9 | 16.1 | |
| MEL | Jay Lockhart | 57 | 45.7 | 11.3 | |
| NM | Nick Larkey | 118 | 93.8 | 24.2 | |
| PA | Kane Farrell | 69 | 53.0 | 16.0 | |
| RIC | Brandon Ellis | 51 | 35.8 | 15.2 | |
| STK | Tim Membrey | 204 | 183.4 | 20.6 | |
| SYD | Sam Reid | 160 | 123.5 | 36.5 | |
| WB | Sam Lloyd | 195 | 182.0 | 13.0 | |
| WCE | Jamie Cripps | 153 | 114.6 | 38.4 |
Worst Kicks for Goal at Each AFL Club
| Team | Player | Actual Points | SI Expected Points | Difference | |
| ADE | Chayce Jones | 13 | 26.9 | -13.9 | |
| BL | Jarrod Berry | 37 | 51.2 | -14.2 | |
| CAR | Will Setterfield | 40 | 63.4 | -23.4 | |
| COL | Jaidyn Stephenson | 137 | 164.3 | -27.3 | |
| ESS | Jayden Laverde | 59 | 77.8 | -18.8 | |
| FRE | Andrew Brayshaw | 24 | 41.8 | -17.8 | |
| GCS | Brayden Fiorini | 18 | 42.3 | -24.3 | |
| GEE | Jordan Clark | 56 | 83.7 | -27.7 | |
| GWS | Brent Daniels | 59 | 72.4 | -13.4 | |
| HAW | Paul Puopolo | 48 | 71.0 | -23.0 | |
| MEL | Max Gawn | 24 | 42.2 | -18.2 | |
| NM | Shaun Higgins | 38 | 52.4 | -14.4 | |
| PA | Justin Westhoff | 72 | 94.2 | -22.2 | |
| RIC | Noah Balta | 39 | 52.5 | -13.5 | |
| STK | Dean Kent | 84 | 114.0 | -30.0 | |
| SYD | Will Hayward | 88 | 123.6 | -35.6 | |
| WB | Marcus Bontempelli | 93 | 130.7 | -37.7 | |
| WCE | Liam Ryan | 116 | 142.6 | -26.6 |
Cameron's Giant Forward Presence
It’s Jeremy Cameron’s world and everyone else is just playing in it.
So far this season, the Giant full-forward has amassed a total of 108 shots on goal to lead all players in the competition.
<ad>
To put this into perspective, #2 on this list, North Melbourne's Ben Brown, has had 82 shots on goal, meaning Cameron has had at least 21.6% more scoring opportunities than anybody else in the league this season.
Looking at the y-axis on the graph below, we can see a dot for the total Stats Insider expected score differential of every player to have taken a shot in 2019, with ‘0’ being the average players' expected score.
On the x-axis we can see the player's total number of shots for goal.
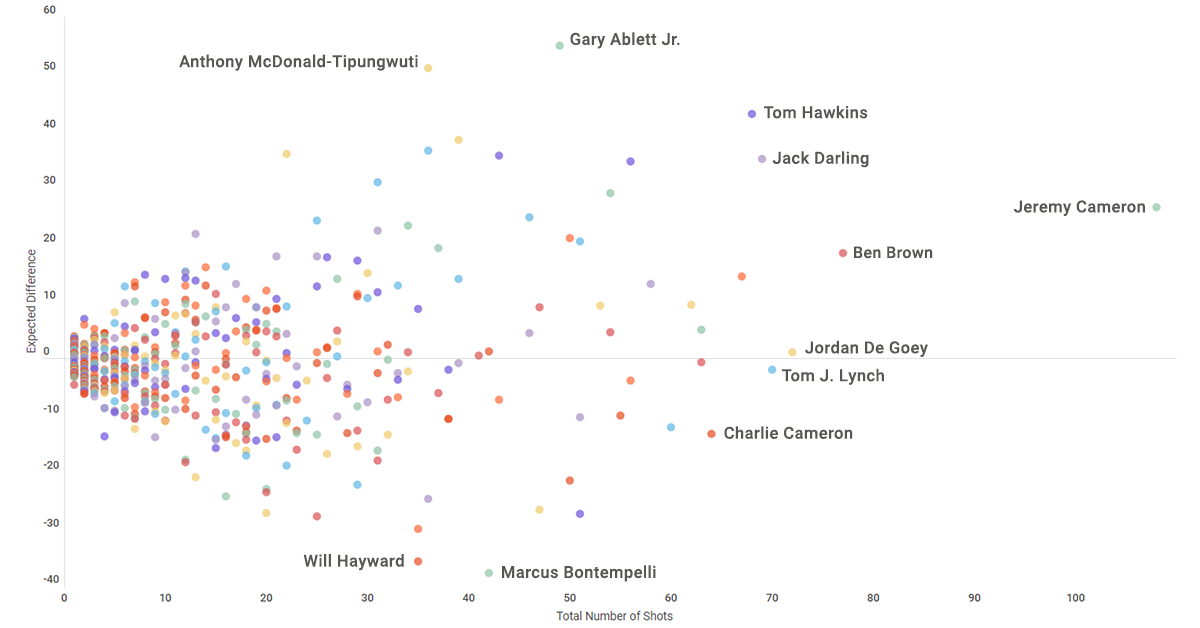
So, it’s not just quantity for the GWS superstar, he’s still well above the league average for accuracy. Proof that Jeremy Cameron is the best forward in the game at the moment.
Did you enjoy this article? Leave a comment below, or join the conversation on the Stats Insider Twitter or Facebook page.