The Inside Guide: Cheat Sheet
Last updated: Oct 5, 2023, 11:34PM | Published: Jun 19, 2019, 7:22AM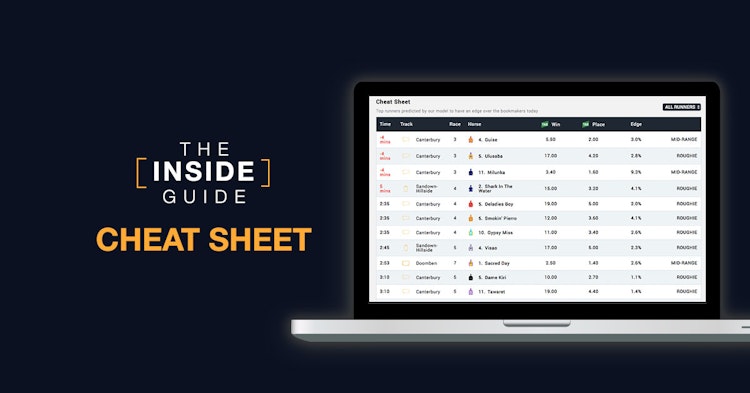
Here at Stats Insider, we are known for - and love - predictive analytics, particularly in the sporting world, and racing is no different. We've custom-built our own Horse Racing model which is trained to predict the win probability of every runner in a particular race – this win probability is what we call the SI %.
By comparing the SI % to the win probability implied by the current bookies' odds, we can determine if the Stats Insider model has identified any ‘value’ on that particular runner.
In broader terms, ‘value’ is where the Stats Insider model is of the view a particular horse has a greater chance of winning the race, than the win percentage implied by the current bookmakers' odds. So if you were to bet on that particular runner, you would be getting some bang for your buck - what we call ‘value’ - according to the Stats Insider model.
The margin between the SI % and the win probability implied by the current bookies odds is what we like to call an 'edge.’
What is the Cheat Sheet?
In a nutshell, the Cheat Sheet is a summary of all the value plays (or 'edges') identified by the Stats Insider model on a particular days' racing, in one convenient, easy to read location. So, if you are after a summary of what the model thinks about an entire day's racing, this may be the tool for you.
GO TO THE NEXT RACEDAY CHEAT SHEET
For example, in the screenshot below from June 26th, we can see BLACK WAND's current TAB fixed odds are $15.00 for Race 4 at Eagle Farm (which implies roughly a 6.6% chance of winning this race). On the Cheat Sheet, under the ‘Edge’ column, we can see the Stats Insider model has identified an edge of 1.1% – meaning it is of the view BLACK WAND a 1.1% greater chance of winning the race compared to the odds.

Working backwards, this would mean the Stats Insider model assessed BLACK WAND's win probability at roughly 7.7%, implying odds that should be around $13, as opposed to $15.
In the screenshot, you may also notice an additional drop-down filter (defaulting to ALL RUNNERS) which groups every horse on the Cheat Sheet into one of the three following categories:
- ‘Hotshots’;
- ‘Mid-Rangers’; and
- Roughies
Hotshots are essentially short priced horses the model has identified an edge on, roughies are horses at longer odds the model has found an edge on and mid-rangers are everything with an edge in between.
The reason for this grouping is so you can gain a better understanding of the likely win probability of runners with similar edges. For example, if you look at WARFARE and GINGER JONES in the above screenshot – the Stats Insider model has identified a similar edge on each runner being 1.5%. However, we can see WARFARE is a $4.60 shot at Randwick-Kensington (which implies it is roughly a 21.74% chance of winning) whereas GINGER JONES is an $8.50 shot at Sandown-Hillside (which implies it is roughly a 11.76% chance of winning the race).
So, despite the fact each runner has a similar edge of 1.5%, there is a difference between what the model believes the likelihood of these horses winning their respective races are. Betting on a roughie and a mid-range runner may have the same return in the long-run - and the roughie will pay more when it does get up - but you might be waiting a bit longer for that roughie to come home.
Which, if any, of these you may prefer to have a punt on is completely up to your own judgement and whatever other information you may bring to the table. The Cheat Sheet also has a filter so if you like to spend your Saturday betting just roughies, or just hot shots, you can narrow the Cheat Sheet to just show the horses relevant to you.
So that you are kept up to date with our models latest information, the Cheat Sheet updates every 10 minutes during a meeting, so if going changes, prior results indicate a bias to one side of the track, or there’s a bunch of scratchings, the selections on this page could change significantly from what you may have viewed at the start of the day.
Its important to note that just because a horse makes its way onto the Cheat Sheet doesn’t mean it’s a tip, just that the model predicts it to be a decent value selection at that point in time – you may have other information that suggests it’s not worthy of your investment and that’s another beauty of the Cheat Sheet – we provide you with the information and you have the choice to use it as you see best!
Keep an eye out for more horse racing content over the coming weeks and months, and, as always, if you are using this information to have a punt please always remember to gamble responsibly.
Did you enjoy this article? Leave a comment below, or join the conversation on the Stats Insider Twitter or Facebook page.