BBL 2019/20: The Trends, Performances and Strategies that Matter
Last updated: Nov 10, 2021, 1:56AM | Published: Jan 15, 2020, 4:40AM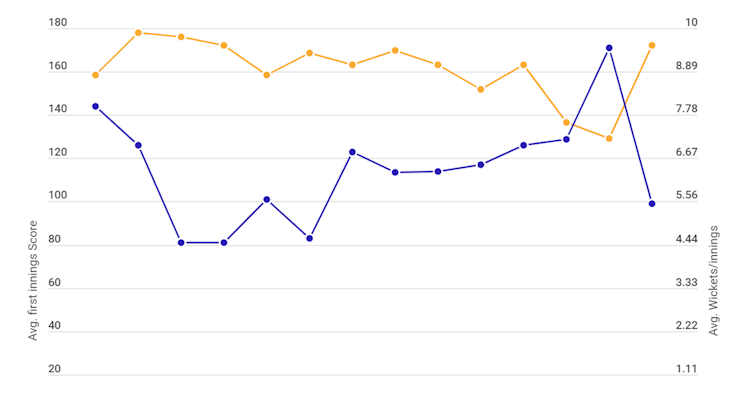
At the halfway mark of BBL|09, the Melbourne Stars occupied the top spot, the bottom place belonged to the reigning champion, Melbourne Renegades, and the entire cricketing world was awaiting the Big Bash League debut of AB de Villiers.
With every passing match, we inch closer to the business end of the tournament. More importantly, fans have begun to get past the initial noise to understand team compositions, strategies, trends and how certain players/teams are playing.
So, we decided to get down to the nitty-gritty data and analyse what’s really happening in terms of team strategies, trends and performances this season.
- LIVE: Follow Every Big Bash Match LIVE on Stats Insider
- JOIN THE MAILING LIST: Subscribe to our free mailing list to get the best content delivered straight to your inbox.
* Statistics as of 16th January 2020. These include one no-result match and the four matches affected by rain or the Duckworth-Lewis method.
Who’s winning the toss (bat flip) and what do the captains elect to do?
The Melbourne Stars have the best win% after winning the toss having won 83.3% of matches but given their superior overall performance, that number is still lower than their overall win% (90%).
Interestingly enough, The second-placed Sixers have lost 75% of their matches where they’ve won the flip of the bat - with just 1 win out of 4 matches - the worst mark for the season so far.
| Teams | Played | Wins | Win% | Toss wins | Toss lost | Toss Win% | Won Toss Bat First | Won toss Field First | Match wins after toss wins | Win% after toss wins | Win% after losing the toss |
| Strikers | 9 | 4 | 44.4% | 4 | 5 | 44.4% | 4 | 0 | 2 | 50.0% | 40.0% |
| Renegades | 10 | 1 | 10.0% | 5 | 5 | 50.0% | 4 | 1 | 1 | 20.0% | 0.0% |
| Hurricanes | 9 | 3 | 33.3% | 5 | 4 | 55.5% | 3 | 2 | 2 | 40.0% | 25.0% |
| Stars | 10 | 9 | 90.0% | 6 | 4 | 60.0% | 1 | 5 | 5 | 83.3% | 100.0% |
| Heat | 9 | 5 | 55.6% | 2 | 7 | 22.2% | 1 | 1 | 1 | 50.0% | 57.1% |
| Scorchers | 10 | 5 | 50.0% | 5 | 5 | 50.0% | 3 | 3 | 3 | 60.0% | 40.0% |
| Sixers | 9 | 6 | 66.7% | 4 | 5 | 44.4% | 0 | 4 | 1 | 25.0% | 100.0% |
| Thunder | 10 | 4 | 40.0% | 6 | 4 | 60.0% | 4 | 2 | 3 | 50.00% | 25.0% |
The Stars and Sixers occupy the top two spots on the BBL table, part of which is down to their 100% win record (5 wins out of 5) when they’ve lost the toss. No other BBL team is above the 50% mark in this metric except the Brisbane Heat.
As expected, at the start of a new season (and with a small sample size), we see that teams winning the toss have won 51.35% of games, indicating winning the bat flip hasn't been a determining factor for the outcome of a match in and of itself.
The captains are nearly split down the middle with their decision to bat or bowl first - 20 batted first, while 18 bowled first.

Strategies:
With one of the best bowling lineups in the league, it’s no surprise that the Adelaide Strikers have won the toss and elected to bat first on all four occasions.
While the Strikers trust their bowlers to defend totals, the Stars and the Sixers put faith in their batting power to chase down any run total. The Sixers have opted to chase every time they have won the toss, while the Stars - with their explosive batting arsenal - have opted to bat first only once out of six times and that was when they played the Hobart Hurricanes at a neutral venue (Ted Summerton Reserve).
Home/Away Record
The home/away records this season wouldn’t paint a true picture since almost every team has used multiple home grounds. In fact, the Hurricanes and Stars have spread their home games across three different grounds.
HOME RECORD
| Home Team (H) | Home Games | Home Wins | Home Losses | Home Win % | Home Loss % | Overall Win % | Difference |
| Strikers | 4 | 2 | 2 | 50.00% | 50.00% | 44.44% | 5.56% |
| Renegades | 5 | 0 | 5 | 0.00% | 100.00% | 10.00% | -10.00% |
| Hurricanes | 5 | 2 | 3 | 40.00% | 60.00% | 33.33% | 6.67% |
| Stars | 5 | 4 | 1 | 80.00% | 20.00% | 90.00% | -10.00% |
| Heat | 5 | 2 | 3 | 40.00% | 60.00% | 55.56% | -15.56% |
| Scorchers | 5 | 2 | 3 | 40.00% | 60.00% | 50.00% | -10.00% |
| Sixers | 4 | 3 | 1 | 75.00% | 25.00% | 66.67% | 8.33% |
| Thunder | 5 | 1 | 3 | 20.00% | 80.00% | 40.00% | -20.00% |
AWAY RECORD
| Away Team (A) | Away Games | Away Wins | Away Losses | Away Win % | Away Loss % | Overall Win % | Difference |
| Strikers | 5 | 1 | 3 | 20.00% | 80.00% | 44.44% | -24.44% |
| Renegades | 5 | 1 | 4 | 20.00% | 80.00% | 10.00% | 10.00% |
| Hurricanes | 4 | 1 | 3 | 25.00% | 75.00% | 33.33% | -8.33% |
| Stars | 5 | 5 | 0 | 100.00% | 0.00% | 90.00% | 10.00% |
| Heat | 4 | 3 | 1 | 75.00% | 25.00% | 55.56% | 19.44% |
| Scorchers | 5 | 3 | 2 | 60.00% | 40.00% | 50.00% | 10.00% |
| Sixers | 5 | 3 | 2 | 60.00% | 40.00% | 66.67% | -6.67% |
| Thunder | 5 | 3 | 2 | 60.00% | 40.00% | 40.00% | 20.00% |
Stadium Stats
Although the sample size at each stadium is rather small, Optus Stadium has been one of the best grounds to score runs at this season, with an average first innings score of 169.8 runs. And, prior to the Perth Scorchers' dismal batting display against the Stars, the average score at Optus was 190 runs/innings.
Every team winning the toss at the MCG has elected to chase so far, while the exact opposite has occurred in the three matches played at the Gabba, where different teams have preferred to bat first and hand Brisbane the responsibility of chasing.

Among the more 'full-time' home grounds, the Sydney Showgrounds stadium remains the only ground which has a 100% win record for teams that have won the toss. The Gabba has seen a low average first innings score (136.66) while the Adelaide Oval has witnessed the most average wickets taken per match (8).
(Stats exclude the matches with no-result and those affected by Duckworth-Lewis Method)
| Stadium | Games | Toss won and Bat | Toss won and Bowl | Toss won and Match won | Avg. first innings Score | Avg. Wkts/match |
| Adelaide Oval* | 4 | 2 | 2 | 3 | 158.60 | 8.00 |
| Blundstone Arena | 3 | 1 | 2 | 1 | 178.00 | 7.00 |
| C.ex Coffs International Stadium | 1 | 1 | 0 | 0 | 176.00 | 4.50 |
| GMHBA Stadium | 2 | 1 | 1 | 1 | 172.00 | 4.50 |
| Marvel Stadium | 3 | 2 | 1 | 2 | 158.60 | 5.60 |
| MCG | 3 | 0 | 3 | 2 | 168.60 | 4.60 |
| Metricon Stadium | 3 | 1 | 2 | 1 | 163.33 | 6.83 |
| Optus Stadium | 5 | 3 | 2 | 2 | 169.80 | 6.30 |
| SCG | 3 | 1 | 2 | 1 | 163.00 | 6.33 |
| Sydney Showground Stadium* | 3 | 2 | 1 | 3 | 152.00 | 6.50 |
| Ted Summerton Reserve | 1 | 1 | 0 | 1 | 163.00 | 7.00 |
| The Gabba | 3 | 3 | 0 | 1 | 136.66 | 7.16 |
| Traeger Park | 1 | 1 | 0 | 1 | 129.00 | 9.50 |
| UNSW Canberra Oval* | 2 | 1 | 1 | 1 | 172.00 | 5.50 |
* Stadiums where games were affected by weather or Duckworth-Lewis method.

BBL09 is heating up, with each team wanting to generate winning momentum into the finals. Will there be a massive change in the trends that we’ve noticed so far? We’ll keep an eye out for all those and more, right here at Stats Insider.
Big Bash LIVE: Next Generation BBL Coverage is More Than Just a Live Score
Did you enjoy this article? Subscribe to our free mailing list to get the best content delivered straight to your inbox. Leave a comment below, or join the conversation on the Stats Insider Twitter or Facebook page.