Inside Brisbane’s Woeful Goalkicking: Who’s To Blame?
Last updated: Aug 28, 2020, 3:10AM | Published: Aug 28, 2020, 12:53AM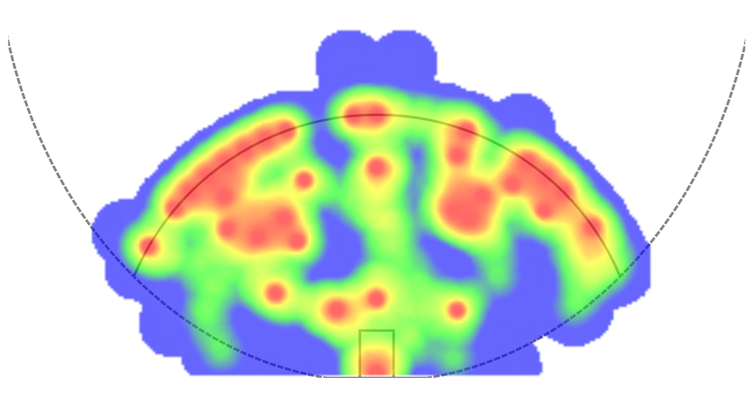
We all know the numbers about Brisbane’s goal kicking; most weeks there’s a fresh one to remind us.
10.23 against Adelaide, 6.10 against Geelong, 7.11 against Melbourne, 4.17 against Richmond, 7.11against North Melbourne, and most recently, 6.14 against St Kilda.
Some of it is due to taking tough shots – keep that in mind for later – but then it’s a double whammy of missing those shots even more than expected.
That one-two punch leads to being the most inaccurate side in the competition and also underperforming its expected score by the furthest margin.
In an excellent piece by Tom Crowley, who used the Stats Insider Expected Scores, over on his Miracle On Graphs blog he correctly asserts that it’s essentially the Lions’ midfielders who are the problem when it comes to inaccuracy.
| 2020 (via Miracle On Graphs) | Total | AFL rank |
| Brisbane’s expected scores from midfielders | 369.2 points | 1st |
| Brisbane’s actual scores from midfielders | -96.2 less than expected score | 18th |
What makes the root of the inaccuracy problem trickier to find is last year, when Brisbane was playing similarly well, the team was scoring relative to expectations.
None of the underlying numbers have changed significantly this year.
Shots are coming from roughly the same distances, they haven’t become exponentially tougher, and the percentage of shots coming from Brisbane’s five most prominent forwards – Charlie Cameron, Eric Hipwood, Lincoln McCarthy, Daniel McStay and Cam Rayner – has decreased too slightly to make any notable scoreboard difference.
| Brisbane’s shot profile | 2019 | 2020 |
| % of shots from 0-24 metres | 22% | 20% |
| % of shots from 25-49 metres | 50% | 55% |
| % of shots from 50+ metres | 28% | 25% |
| Expected points per shot | 3.15 | 3.16 |
| % of shots taken by main forwards | 49.3% | 46.3% |
Data provided Courtesy of Stats Insider's Shot-Charting Explorer
Nothing in those numbers point to a reason for Brisbane’s output to go from right on its expected score to worst in the league within the space of one season.
But we are left with two potential reasons for the slide, which work hand in hand.
To explain the first, it’s time to head to the bookshelf.
RELATED: Is The Lions Midfield Good Enough To Win The Flag?
THE SHOT PROFILE OF SECONDARY SCORERS
In James Coventry’s must-read book Footballistics, an extended look into goal kicking trends revealed secondary scorers – i.e. midfielders – are more affected by pressure than primary forwards and usually forced to take harder shots at goal.
“Because the defensive zones are better these days, the profile of where players are kicking from has changed. They’re now being forced further from the goal and further towards the sides as well,” sports biomechanics lecturer Dr Kevin Ball told Coventry.
This fits neatly into the Lions’ propensity for firing at will as we mentioned earlier. Only Gold Coast (3.07 expected points per shot), Sydney (3.08) and Collingwood(3.13) take tougher shots on goal than Brisbane (3.16).
Add that into the reliance on the midfielders to hit the scoreboard – more expected points than any other team as detailed.
It leaves a combination of a high degree of difficulty on a lot of shots taken by midfielders. It will naturally lead to a high variance in output and goes a long way to explaining how Brisbane can fluctuate from kicking 14.7 one week, to 4.17 the next.
That explains most of the inaccuracy, but there is one more point; an unintended consequence of a successful style.
RELATED: From Sinners to Saints: How St Kilda Revolutionised Its Goalkicking
WORKING AGAINST A SET DEFENCE
When Brisbane is up and running, it generates plenty of repeat inside-50 entries. Opposition sides just can’t get out of their back half, turning it over again and again at every opportunity.
It’s a sign of a team adept at stopping transition and eventually, weight of numbers tends to tell on the scoreboard. Brisbane has been a top-five side in inside-50 differential, both this year and last.
However, what repeat entries usually stops you from doing is generating high quality shots on goal.
When a side is pinned back, trying – and failing – to clear the ball, more and more numbers drop back. Brisbane builds a wall, wins the ball back and tends to be met with something like this most weeks:
It’s tough to consistently find clean shots on goal when faced with those sorts of numbers to work through. Working around it to take shots from wider and longer can be a strategy employed to draw opponents out, but often they’re content to
let Brisbane fire away from low percentage areas – which has happened regularly.
Brisbane's Shot Locations-2019 versus 2020
When looking at the whole Brisbane picture, it has a successful game style, just about every piece of the ground working well, and a high variance approach for shots on goal.
It all boils down to this: trust the style which has led to a 26-11 record over the last two seasons, or tweak it to try and get higher quality shots on goal?
Whichever way the decision goes, it’ll have a heavy influence on Brisbane’s premiership aspirations.
Did you enjoy this article? Join our free mailing list to get the best content delivered straight to your inbox, or join the conversation by leaving a comment below or on the Stats Insider Twitter or Facebook page.