AFL 2019 - How did your team perform in each quarter?
Last updated: Sep 3, 2019, 6:05AM | Published: Jul 17, 2019, 5:40AM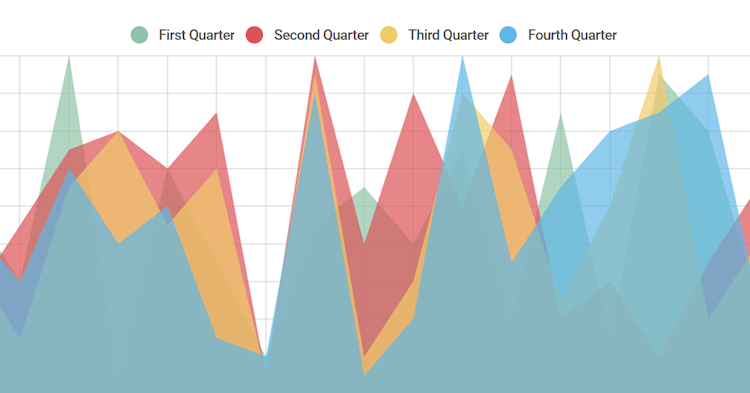
With Finals football only few days away, we thought it'd be a perfect time to take a deeper look at some of the AFL's underlying metrics.
And while ultimately, all the ladder really cared about is who did and who didn't make the AFL finals in 2019, it's always worth taking a deeper dive to examine just how and why clubs arrived at their final destinations.
There's of course a tonne of analytical devices we can call upon to better understand what's taking place on the field, and one tool of analysis too often overlooked is breaking down a game from a quarter by quarter perspective.
By distilling a match into smaller portions we're able to get under the bonnet and discover insights into where games are being won and lost. What we found in 2019 was really quite intriguing.
First Quarter:
Richmond finished first place with 16 first quarter wins, while their 159.38% percentage was the best mark by any team in any quarter. Geelong and West Coast followed, while Alistair Clarkson's Hawks completed the Top 4.
By watching Collingwood's first halves in 2019, you'd be aware that it wasn't too often the Pies headed for the quarter time huddle behind on the scoreboard. But thanks to injuries and a difficult second half of the season, the Magpies fell all the way to fifth on the first quarter ladder.
It’s also interesting to note that the Swans actually outperformed Top 8 teams such as Essendon, the Bulldogs, Brisbane and the Giants in the first term, having won 11 first quarters on the season.
Position | Team | Played | Win | Loss | Draw | %Won | Percentage |
1 | Richmond Tigers | 22 | 16 | 6 | 0 | 72.73% | 159.38% |
2 | Geelong Cats | 22 | 15 | 6 | 1 | 70.45% | 134.11% |
3 | West Coast Eagles | 22 | 14 | 7 | 1 | 65.91% | 127.52% |
4 | Hawthorn Hawks | 22 | 13 | 8 | 1 | 61.36% | 122.72% |
5 | Collingwood Magpies | 22 | 13 | 8 | 1 | 61.36% | 117.53% |
6 | North Melbourne Kangaroos | 22 | 11 | 10 | 1 | 52.27% | 128.28% |
7 | Sydney Swans | 22 | 11 | 10 | 1 | 52.27% | 95.05% |
8 | Brisbane Lions | 22 | 11 | 11 | 0 | 50.00% | 99.16% |
9 | GWS Giants | 22 | 10 | 12 | 0 | 45.45% | 117.46% |
10 | Melbourne Demons | 22 | 10 | 12 | 0 | 45.45% | 87.40% |
11 | Western Bulldogs | 22 | 9 | 11 | 2 | 45.45% | 99.22% |
12 | Fremantle Dockers | 22 | 9 | 12 | 1 | 43.18% | 93.64% |
13 | Adelaide Crows | 22 | 9 | 12 | 1 | 43.18% | 92.36% |
14 | Gold Coast Suns | 22 | 9 | 12 | 1 | 43.18% | 74.10% |
15 | Essendon Bombers | 22 | 9 | 13 | 0 | 40.91% | 89.07% |
16 | Port Adelaide Power | 22 | 8 | 13 | 1 | 38.64% | 74.39% |
17 | St Kilda Saints | 22 | 7 | 14 | 1 | 34.09% | 75.43% |
18 | Carlton Blues | 22 | 7 | 14 | 1 | 34.09% | 68.66% |
<ad>
Second Quarter:
They might have finished 14th on the ladder, but with 15 wins, the Saints were actually joint-leaders with Richmond for most second quarter wins.
Geelong, third on the list, had the league's best, second term percentage at 133.05, while special mention must go the Gold Coast Suns whose four wins were the very worst performance by any team, in any quarter- as too was their deplorable 48.81 percentage in the second term.
Position | Team | Played | Win | Loss | Draw | %Won | Percentage |
1 | St Kilda Saints | 22 | 15 | 6 | 1 | 70.45% | 118.58% |
2 | Richmond Tigers | 22 | 15 | 6 | 1 | 70.45% | 115.21% |
3 | Geelong Cats | 22 | 15 | 7 | 0 | 68.18% | 133.05% |
4 | Port Adelaide Power | 22 | 13 | 8 | 1 | 61.36% | 128.80% |
5 | Adelaide Crows | 22 | 12 | 8 | 2 | 59.09% | 126.79% |
6 | Brisbane Lions | 22 | 12 | 8 | 2 | 59.09% | 112.21% |
7 | Western Bulldogs | 22 | 12 | 9 | 1 | 56.82% | 109.87% |
8 | Sydney Swans | 22 | 11 | 11 | 0 | 50.00% | 99.55% |
9 | GWS Giants | 22 | 10 | 9 | 3 | 52.27% | 126.11% |
10 | Collingwood Magpies | 22 | 10 | 11 | 1 | 47.73% | 108.59% |
11 | Essendon Bombers | 22 | 10 | 11 | 1 | 47.73% | 89.03% |
12 | Melbourne Demons | 22 | 9 | 12 | 1 | 43.18% | 88.40% |
13 | Carlton Blues | 22 | 9 | 12 | 1 | 43.18% | 76.58% |
14 | West Coast Eagles | 22 | 9 | 13 | 0 | 40.91% | 100.65% |
15 | Hawthorn Hawks | 22 | 9 | 13 | 0 | 40.91% | 92.93% |
16 | North Melbourne Kangaroos | 22 | 8 | 14 | 0 | 36.36% | 87.55% |
17 | Fremantle Dockers | 22 | 7 | 14 | 1 | 34.09% | 76.46% |
18 | Gold Coast Suns | 22 | 4 | 18 | 0 | 18.18% | 48.81% |
Third Quarter
Brisbane finished out on top with 16 wins, while Geelong, Giants and the Swans rounded out the top four.
Interestingly, St Kilda, the equal best team in the competition where second quarter performance was concerned, slid all the way to last for third quarter performance with just five wins and sixteen losses on the season.
Position | Team | Played | Win | Loss | Draw | %Won | Percentage |
1 | Brisbane Lions | 22 | 16 | 5 | 1 | 75.00% | 150.77% |
2 | Geelong Cats | 22 | 15 | 7 | 0 | 68.18% | 145.92% |
3 | GWS Giants | 22 | 14 | 8 | 0 | 63.64% | 123.64% |
4 | Sydney Swans | 22 | 13 | 9 | 0 | 59.09% | 96.08% |
5 | Port Adelaide Power | 22 | 12 | 9 | 1 | 56.82% | 116.36% |
6 | Western Bulldogs | 22 | 12 | 10 | 0 | 54.55% | 113.23% |
7 | Richmond Tigers | 22 | 12 | 10 | 0 | 54.55% | 94.21% |
8 | Collingwood Magpies | 22 | 11 | 10 | 1 | 52.27% | 116.08% |
9 | West Coast Eagles | 22 | 11 | 11 | 0 | 50.00% | 114.57% |
10 | Essendon Bombers | 22 | 11 | 11 | 0 | 50.00% | 100.96% |
11 | Carlton Blues | 22 | 11 | 11 | 0 | 50.00% | 97.82% |
12 | Hawthorn Hawks | 22 | 10 | 12 | 0 | 45.45% | 113.82% |
13 | Fremantle Dockers | 22 | 10 | 12 | 0 | 45.45% | 94.70% |
14 | Adelaide Crows | 22 | 9 | 13 | 0 | 40.91% | 90.06% |
15 | North Melbourne Kangaroos | 22 | 9 | 13 | 0 | 40.91% | 84.85% |
16 | Melbourne Demons | 22 | 8 | 14 | 0 | 36.36% | 70.64% |
17 | Gold Coast Suns | 22 | 7 | 15 | 0 | 31.82% | 55.70% |
18 | St Kilda Saints | 22 | 5 | 16 | 1 | 25.00% | 71.11% |
Fourth Quarter
The Lions led the league where final stanza performance was concerned netting 14 wins while the Hawk's barnstorming finish to the season was reflected in their 13 last quarter wins.
With 12 fourth quarter victories in 2019, Geelong and Collingwood completed the Top 4.
After 17 games this season, the Giants were ranked first on the Final Term ladder with 11 wins, however in the final ten matches they managed just one fourth quarter win, resulting in a slide down to the eighth spot.
Position | Team | Played | Win | Loss | Draw | %Won | Percentage |
1 | Brisbane Lions | 22 | 14 | 8 | 0 | 63.64% | 115.75% |
2 | Hawthorn Hawks | 22 | 13 | 8 | 1 | 61.36% | 106.57% |
3 | Geelong Cats | 22 | 12 | 9 | 1 | 56.82% | 129.43% |
4 | Collingwood Magpies | 22 | 12 | 9 | 1 | 56.82% | 128.50% |
5 | Port Adelaide Power | 22 | 12 | 10 | 0 | 54.55% | 113.75% |
6 | North Melbourne Kangaroos | 22 | 12 | 10 | 0 | 54.55% | 103.09% |
7 | Richmond Tigers | 22 | 12 | 10 | 0 | 54.55% | 100.69% |
8 | GWS Giants | 22 | 12 | 10 | 0 | 54.55% | 97.19% |
9 | Carlton Blues | 22 | 11 | 9 | 2 | 54.55% | 98.40% |
10 | Adelaide Crows | 22 | 11 | 10 | 1 | 52.27% | 98.94% |
11 | West Coast Eagles | 22 | 11 | 11 | 0 | 50.00% | 108.92% |
12 | Essendon Bombers | 22 | 11 | 11 | 0 | 50.00% | 102.80% |
13 | Fremantle Dockers | 22 | 10 | 11 | 1 | 47.73% | 104.71% |
14 | Western Bulldogs | 22 | 10 | 12 | 0 | 45.45% | 108.06% |
15 | Sydney Swans | 22 | 9 | 10 | 3 | 47.73% | 100.23% |
16 | St Kilda Saints | 22 | 9 | 13 | 0 | 40.91% | 79.36% |
17 | Melbourne Demons | 22 | 6 | 16 | 0 | 27.27% | 71.93% |
18 | Gold Coast Suns | 22 | 6 | 16 | 0 | 27.27% | 64.36% |
<ad>
All Quarters
As expected, the 2019 Minor Premiers, Geelong, had the the most total quarters won in 2019 with 57 from their 88 played. Among the Finals teams, Essendon won the least quarters (41).
At the other end of the Quarters Won table, Fremantle, St Kilda, Melbourne and the Suns filled out the bottom four spots on the overall ladder.
Position | Team | Played | Win | Loss | Draw | %Won | Percentage |
1 | Geelong Cats | 88 | 57 | 29 | 2 | 65.91% | 135.70% |
2 | Richmond Tigers | 88 | 55 | 32 | 1 | 63.07% | 113.70% |
3 | Brisbane Lions | 88 | 53 | 32 | 3 | 61.93% | 118.30% |
4 | Collingwood Magpies | 88 | 46 | 38 | 4 | 54.55% | 117.74% |
5 | GWS Giants | 88 | 46 | 39 | 3 | 53.98% | 115.40% |
6 | Port Adelaide Power | 88 | 45 | 40 | 3 | 52.84% | 105.37% |
7 | Hawthorn Hawks | 88 | 45 | 41 | 2 | 52.27% | 108.74% |
8 | West Coast Eagles | 88 | 45 | 42 | 1 | 51.70% | 112.48% |
9 | Sydney Swans | 88 | 44 | 40 | 4 | 52.27% | 97.71% |
10 | Western Bulldogs | 88 | 43 | 42 | 3 | 50.57% | 107.24% |
11 | Adelaide Crows | 88 | 41 | 43 | 4 | 48.86% | 100.85% |
12 | Essendon Bombers | 88 | 41 | 46 | 1 | 47.16% | 95.40% |
13 | North Melbourne Kangaroos | 88 | 40 | 47 | 1 | 46.02% | 99.45% |
14 | Carlton Blues | 88 | 38 | 46 | 4 | 45.45% | 84.46% |
15 | Fremantle Dockers | 88 | 36 | 49 | 3 | 42.61% | 91.91% |
16 | St Kilda Saints | 88 | 36 | 49 | 3 | 42.61% | 83.89% |
17 | Melbourne Demons | 88 | 33 | 54 | 1 | 38.07% | 78.65% |
18 | Gold Coast Suns | 88 | 26 | 61 | 1 | 30.11% | 60.53% |
The Tigers, Lions, Dogs and Pies come into September with some momentum from the final few rounds of the season, yet the Finals are a different beast altogether where the caliber of opposition jumps significantly.
In September, each and every quarter takes on 'make or break' importance, while one half-hour of excellence or ineptitude could well be the difference between premiership glory and a sad 'Mad Monday'.
Did you enjoy this article? Leave a comment below, or join the conversation on the Stats Insider Twitter or Facebook page.