Centre Bounce Attendances: Who’s Driving Your Club’s Engine Room?
Last updated: Aug 18, 2020, 6:46AM | Published: Aug 18, 2020, 5:43AM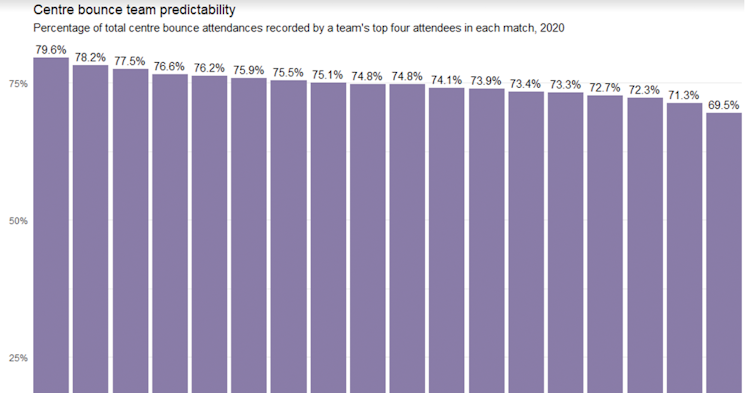
Centre bounce attendances are an AFL stat that has become more accessible in 2020, a win for footy stats nerds like yours truly everywhere.
Today, I’ve gathered all the numbers from the first 11 rounds of the season in one place, and we’ll take a look at few of the interesting trends happening so far this year.

This table represents my best attempt at working out every AFL club’s preferred centre-bounce team, based on the percentage of centre bounces each player has attended in the matches they’ve played in 2020.
For most of the teams this is simply their top four players for centre bounce attendance percentage, but in some cases adjustments needed to be made, mostly for teams like Essendon, GWS or Geelong who’ve played a variety of rucks during the year.
I also took Luke Dunstan and Jack Bytel out of the equation for St Kildaas, at the end of Round 11, both had played only a single game. Other than that, the table is basically true to who the numbers say is attending the most centre bounces at each club, when available.
That means players like Ben Cunnington (3 games) and Jake Stringer (4) are included here despite spending most of the season so far injured. Matt Rowell could be in there for Gold Coast if he hadn’t missed most of his game against Geelong, too.
There are a few names worth pointing out here – one of which is Caleb Serong, who in less than 10 games at AFL level has already become one of Fremantle’s preferred centre bounce players and a very strong contender for the Rising Star award.
Ben Keays has gone from delisted free agent to a regular at the centre bounces for Adelaide, Josh Dunkley is conspicuously absent from the Bulldogs’ preferred team, and Matt Kennedy has
the lowest attendance percentage of anyone in a club’s top four.
While winning the clearance isn’t the only thing a centre bounce team should be focused on, you’d imagine it’s at the forefront of their minds.
This chart shows the top 25 players in the AFL ranked on the percentage of their centre bounce attendances from which they win a centre clearance.
That is to say, Taylor Adams wins the clearance 19.6% of the time when he attends a centre bounce – the best in the competition, of players who’ve attended at least 100 centre bounces in 2020.
Most of the names here are ones you’d expect, but there are a few worth highlighting.
Shai Bolton is someone who wasn’t really billed as an inside midfielder when he was drafted into the AFL, but has slid into that position over the last few weeks and shown that he has a real aptitude for it.
As the table above shows, he’s clearly capable of winning clearances when played in the engine room, but he’s also a dynamic and creative player, which turns him into a real weapon.
Jade Gresham, also in the top ten, is in a similar mould as something of a smaller-sized player who is showing he can match it with the big boys in the ball-winning stakes, but is also a really skilful user of the ball.
It’s also notable that Nic Naitanui is the only ruckman to feature in the top 25 here. In fact, the bottom end of this stat is dominated by ruckmen, and this high ranking really stands out as a point of difference in Naitanui’s game.

There’s many questions that could be asked and answered by pouring over the centre bounce numbers for players and clubs. The one that I wanted to look at today is this: which teams are the most predictable – or unpredictable – in the players they use?
The chart above is one way of measuring this. It was created by determining which four players had the most centre bounce attendances for each team in each match, and then calculating what percentage of a team’s total centre bounce attendances that top four makes up.
Think of it this way: for the Western Bulldogs, 79.6% of centre bounce attendances come from the team’s top four preferred centre bounce players on the day. The remaining 20.4% are from players being rotated through there.
That makes the Dogs the league’s most predictable centre bounce team – if you’re coaching against them, you know they’re not going to vary it up across the course of the match as much as other teams might do.
Meanwhile, Fremantle sit at the other end of the scale as the league’s least predictable.
One thing you’ll notice about this chart is that there are some good and bad teams at either end of the scale. That leads to another question – does centre bounce predictability matter? And if so, is it a good thing?

This chart shows each result from the 2020 AFL season up to the end of Round 11 by the home team’s points scored differential and predictability rating differential. We’re looking to determine if there’s any kind of correlation between the two.
If you’re looking at the chart and thinking the answer to our question is “sort of, maybe” – well, that’s about right.
The numbers suggest that there may be a very small trend in favour of teams whose centre bounces are more predictable than their opponents - but the results aren’t statistically significant, so you wouldn’t put any stock into it right now.
And of course even if there was a significant relationship, the possible explanations for it could be many.
It would be simple to suggest that the more settled a centre bounce team, the better a team’s chances of winning – but that may not be the right order of chicken and egg.
It could also perhaps be the case that when teams start losing, they’re more likely to start changing up their centre bounce choices as the coaching team switches to “Plan B”, and that losing leads to unpredictability rather than other way around.
It’s clear that there are some very good teams who have less predictable centre bounce setups, like Richmond, Geelong and Brisbane, but also some poorer ones, like the Crows, Hawks or Dockers.
Every side approaches it differently, and it’s an area that will be interesting to consider further in the future
This article is provided by a guest writer. Some of the stats and figures contained within were provided by the author, in this case sourced from afl.com.au; and do not constitute Stats Insider data. All opinions are that of the writer.
Did you enjoy this article? Join our free mailing list to get the best content delivered straight to your inbox, or join the conversation by leaving a comment below or on the Stats Insider Twitter or Facebook page.