A New and Improved Cricket Model for Big Bash 2018
Last updated: Dec 18, 2018, 2:35AM | Published: Dec 4, 2018, 6:05AM
Summer is here, and that means it’s time for cricket projections on Stats Insider, more specifically, the 2018/19 Big Bash League.
With last year’s model a great test case for developing this season’s iteration, the new Stats Insider BBL model has been rebuilt following substantial research to combine micro-level data with performance factors for each individual batsman and bowler, as well as looking at in-game Match Situation variables. This is used to simulate the outcome of every delivery of every match.
Based on ball-by-ball, batter vs bowler data, this data gets pretty granular on the specific factors that impact a team’s likelihood of winning a match.
Predictive models have long been used by sports nerds, daily fantasy and long form fantasy players. It is also highly applicable to team recruitment and selection decisions, and on Stats Insider, we also display it in a way to help our users identify value against bookmakers.
For all of the purposes above, we think we’ve built one of - if not the single - most advanced cricket models available, here’s why:
READ: "The Winner of the Big Bash Revealed - how our Simulator Works"
Stats Insider’s Big Bash Model
INDIVIDUAL PLAYER PERFORMANCE
The model looks at every ball delivered in the Australian Twenty20 domestic competition over the last four seasons. We take into account the players’ recent form, as well as performances from overseas Twenty20 competitions, to determine the likelihood of the result of each and every delivery, ie; from being a dot ball, to hitting a six, to taking a wicket.
For example: by tracking every ball Chris Lynn has faced in the last four Big Bash seasons, we can predict his batting performances - down to individual deliveries - in this season’s competition. For new Big Bash players such as Joe Root, we look at his overseas and international Twenty20 performances to determine his potential output in this season’s competition.
MATCH SITUATION
While every ball in the Big Bash is important, not all Twenty20 deliveries are created equal. Factors such as which over the batting team is in, how many wickets they are down, and the required run rate for a team batting second, all play a part is what is likely to happen for any given delivery.
For example, as you might expect, the data shows the probability of a batsman hitting a four is at its highest during the powerplay when the field is up and in close. The probability then drops off as the powerplay ends, before a progressive rise in likelihood as the inning progresses. This is all taken into account by our new model as it forecasts the outcome of a game.

IN-GAME PERFORMANCE
One common commentators’ adage is that a quick wicket or two will build up pressure on the batting team - the suggestion being that a new batsman (or two) would be slower to score than the incumbent runners, as well as having a higher chance of losing their wicket than a batsman who has been in for a significant amount of time.
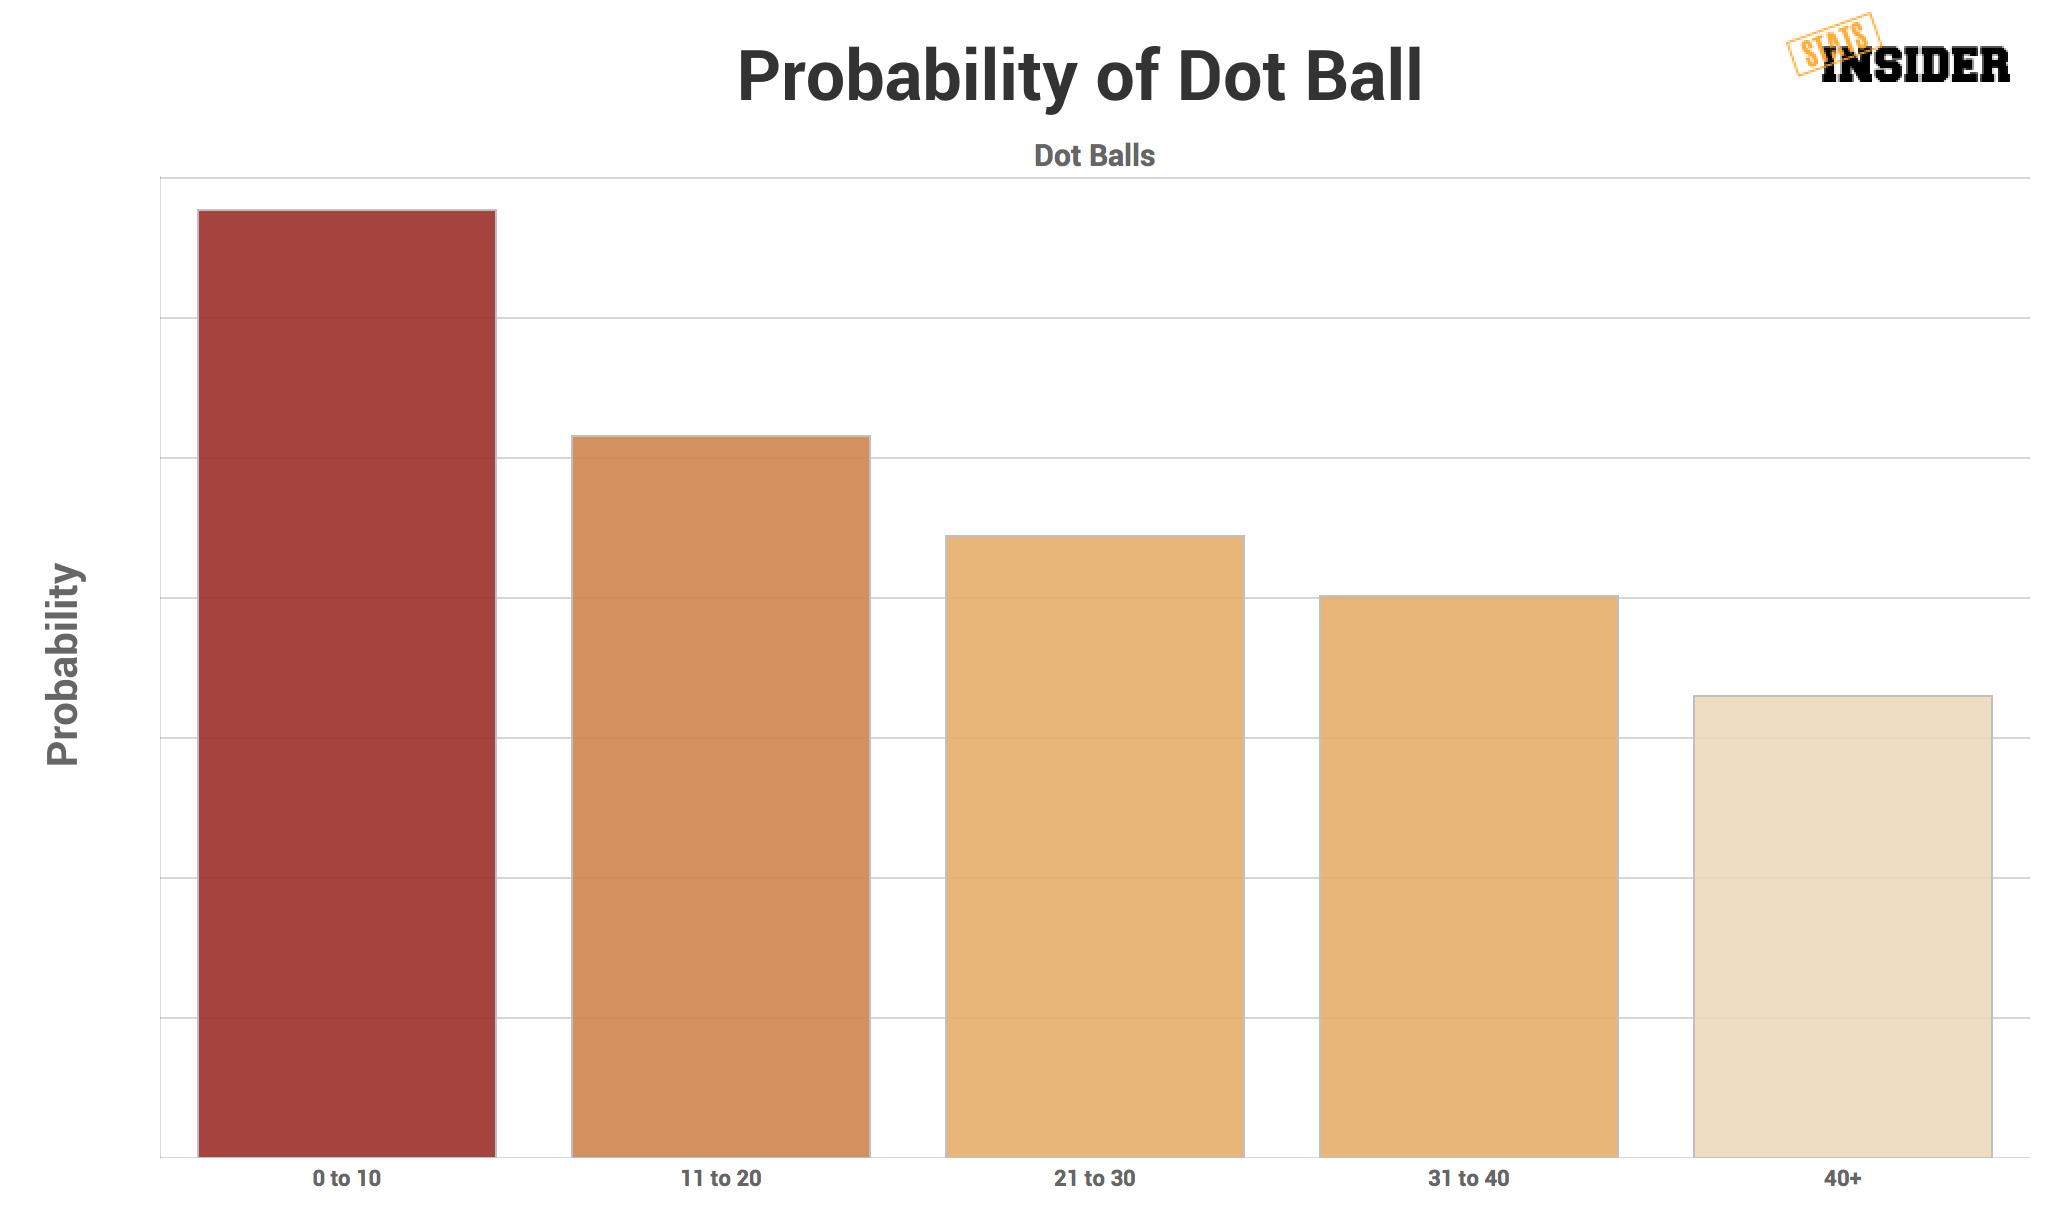
The data agrees to an extent. The probability of a dot ball is lower for a new batsman, suggesting a wicket will cut the scoring rate, but the probability of a wicket barely changes -- in fact, in T20, a batsman who’s been in longer is more likely to get out. We like to call this our in-game performance factor:

LOCATION (GROUNDS)
Part of the charm of the Australian summer is the yearly tour we get to take of our nation’s best cricket venues, whether it be the old scoreboard and shorter square boundary of the picturesque Adelaide Oval, or the famous cauldron of the mighty MCG. Each ground has its own unique identity. We utilise the ground size and boundary distance to model their influence on the outcome of a delivery.
PREDICTIONS
Our proprietary algorithm combines all of the micro level data to calculate the projected likelihood of every outcome of each given delivery at any specific point in that match.
For example; our model is now able to calculate the likelihood of Glenn Maxwell hitting Andrew Tye for six in the 20th over of the match, given the precise state of the match being simulated.
Treating every delivery as a single contest between bat and ball, batsman versus bowler (taking into account match situation as well as various other factors), the model uses a Monte Carlo approach to simulate every game 10,000 times in order to understand the range of possible outcomes and how likely each of those outcomes is to occur. If a team wins 4,000 of our pre-match simulations, we project them to be a 40% chance to win the upcoming game.
Based on the market prices, this may or may not be a good value bet. For example, if both teams are equal at $1.88 head-to-head, this implies the bookmaker projections are 50/50 for either side to win. If our model’s projection has one team at 40% and the other at 60% chance to win, this shows a clear “edge” to one side of the market.
HOW TO USE THIS: What is ’The Edge?’
This model - or the outcomes from it - will be published on Stats Insider and across our social channels in the next few days and weeks leading up to the Big Bash on 19 December. If you’re keen to have a look, you can play around with our BBL Tournament Simulator. Full futures predictions will be published over the next few days and you can expect to see individual match pages on site a few days out from the first game.
Take advantage of our Cricket model with a free trial of Stats Insider Premium.