Shot Charting Trends: Richmond and Geelong's Goalkicking in 2020
Last updated: Oct 21, 2020, 2:11AM | Published: Oct 21, 2020, 1:15AM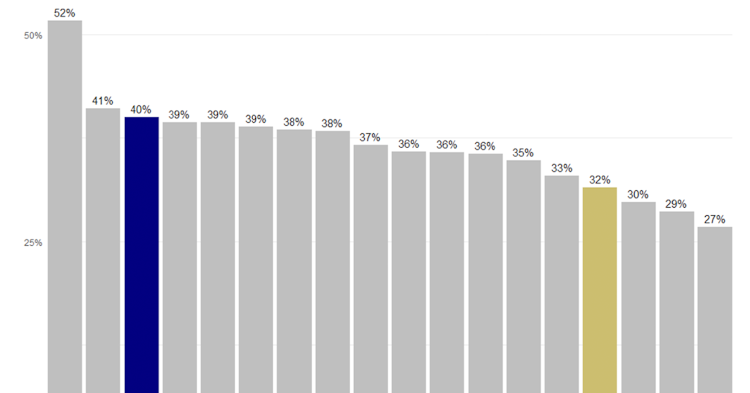
Saturday night’s grand final between Richmond and Geelong is looking like one of the toughest to predict in some time – right now, Stats Insider’s own projections are struggling to separate the two teams, favouring Richmond with a 51/49 split.
Many elements will go into determining just who comes out on top and claims the 2020 premiership cup. One that has been important for more than a hundred years and only grown more crucial is the accuracy of shots on goal.
Stats Insider’s shot charting tool can give us a significant insight into how Richmond and Geelong compare. It essentially boils down to two things: the ability to create quality shots on goal, and the ability to then convert them.
For the former, we can look at each team’s expected points per shot – that is, the average expected score from all the shots on goal they’ve taken across the year. Higher values will indicate that clubs are generating better quality
shots on goal than the competition average.
The first thing you might notice looking at this chart is that there’s not a huge degree of variation across the competition. The #1 side, St Kilda, is getting just 0.4 expected points more per shot than Sydney – a margin of eight points in a match if we were to assume both had 20 scoring shots.
That certainly could be significant in a close game, but it probably wouldn’t be if one team is producing significantly more shots than the other. Of course, the grand final we’re talking about is expected to be a close game – so it could be important.
RELATED: Damien Hardwick and Chris Scott Are The Grand Final's Biggest Figures
The numbers here suggest Geelong and Richmond are both in the top half of the competition when it comes to expected score per shot, and there isn’t a huge difference between them – just 0.03 points per shot.
So, both teams are creating scoring shots of a good quality, as you’d expect for the two sides playing off in the grand final, and neither has a significant advantage here on the other. But the nature of those shots, and the outcomes they’re getting from them, are noticeably different.

This chart shows the percentage of expected score realised by each AFL team in the 2020 home-and-away season – and it shows a much wider gulf between our two grand final participants than the previous one did.
Geelong have been the most accurate side in the competition by Stats Insider’s measure, realising 107% of their expected score across the season. That’s +82.3 points on their expected score, nearly five points a game derived from their excellent accuracy.
Richmond on the other hand are firmly in the middle of the pack, their 98% being roughly on par in a year where only four of the AFL’s 18 teams have outperformed their expected score for the season. It’s not necessarily a weakness of the Tigers, but it’s definitely not a strength.
When it comes to the ball movement used to create scoring shots, Richmond and Geelong could hardly be more different. The Tigers move the ball at 121 metres gained per minute, the fastest of any team in the competition, while the Cats go at 101, the slowest of any side.
The Cats’ slower, methodical approach means 54.4% of their shots on goal are from set shots, the fourth highest of any side in the league. Richmond on the other hand are ranked 13th, and they instead take 52.2% of their shots from general play.
Richmond like to take their shots as close to goal as possible – they’re ranked No.4 in the league this year for lowest average shot distance. And this chart tells you why they’re targeting that close range – when distance gets beyond 30m, they’re in the bottom for least accurate teams in the competition.
Geelong on the other hand appear to place more value on finding the best angle – they’re the #1 side for lowest average angle on goal, but only 14th for lowest average distance.
This makes sense with what we know about both teams: the Tigers like to rush the ball close to goal so they can take short-range shots out of general play, where the finishing ability of their smaller forwards might prove most advantageous.
Geelong also likes to take their time and create set shots from as favourable an angle as possible – and if they have to kick the ball a little bit further to make that work, they’re not afraid to do so.

While the Cats have made an art of getting their shorts from the straightest angle they can, the numbers suggest that being on a wider angle isn’t something that should seriously worry them – if anything, it’s the Tigers who should focus on this more.
Geelong are still one of the competition’s most accurate teams when it comes to kicking on an angle of 50 degrees or more, but the Tigers struggle from those positions, ranked 15th.
RELATED: Charting The AFL Premiership Clock: How Far Is Your Club From Its Next Flag?
Overall, the numbers suggest that Geelong have an edge on Richmond: they’re a more accurate side when it comes to kicking for goal, and that’s true even if they’ve got a significant distance or tricky angle to overcome.
Richmond on the other hand do better when their shots are as close and direct as possible. Of course, that’s true of any team, but the Tigers suffer a noticeable decline in accuracy when forced far or wide that Geelong might be able to exploit.
If the Cats can defend that hotspot well and force the Tigers to take shots from less favourable positions, then they might find that their opponents have a tough day in front of goal – and wind up giving the ball back more often than not.
Richmond could however focus on disrupting Geelong’s slow and steady ball movement. They like to play an intense, high-tempo game – if they can pressure Geelong into doing the same, it might hinder the Cats ability to create good scoring shots, and win them the match.
How will these two game styles clash on the biggest stage of all? Last time these two clubs met Richmond’s fast-paced play demolished the Cats – and whether or not Geelong alter their plans based on that may decide who takes home the cup.
This article is provided by a guest writer. Some of the stats and figures contained within (in this case courtesy of the fitzRoy R package) were provided by the author. All opinions are that of the writer.
Did you enjoy this article? Join our free mailing list to get the best content delivered straight to your inbox, or join the conversation by leaving a comment below or on the Stats Insider Twitter or Facebook page.