AFL Sackometer: A data-driven method for gauging coach pressure
Last updated: May 16, 2019, 7:57AM | Published: May 16, 2019, 6:40AM
A constant topic of discussion around office water coolers and talkback radio is the performance of AFL senior coaches, and whether they’re performing adequately enough.
In an attempt to see through the newspaper puff pieces and fan's knee-jerk reactions, we at Stats Insider HQ are asking;
Can you objectively judge a coach's future using data alone?
We can, but to accurately answer this question, we first need a way of gauging what the expectation for each coach is.
We can’t seriously expect Stewie Dew at the Gold Coast Suns to have the same win percentage over the last 20 games as Damien Hardwick at Richmond, so to compare the two coaches, we had to get a little creative.
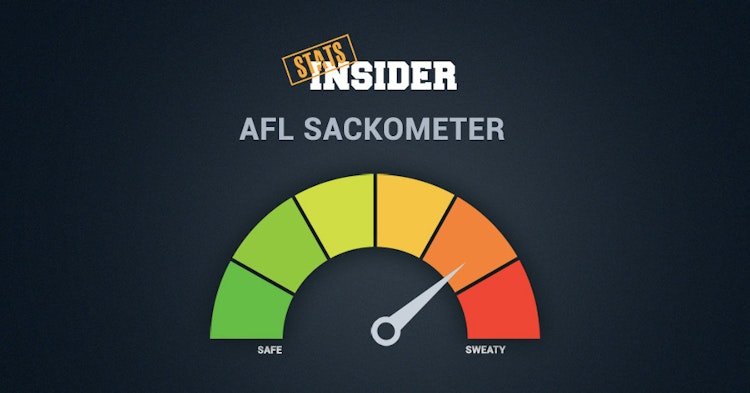
Introducing Stats Insider's AFL Sackometer - a dynamic visualisation of every coach in the league and how much 'pressure' we perceive them to be under, depending on a number of key factors. This is not a ride-or-die truth gauge on who's about to get the sack, but rather an indication of which coaches might be finding their seats getting slightly warmer each week.
So, how do we gauge which coaches are feeling the pressure vs those with their feet up? Below, I’ll attempt to walk you through our theory.
Using the 'Bookmaker's line'
We have to start here as this variable makes up the bulk of our theory.
I’ll assume that most people reading this understand how a bookie's 'line' (also known as a point 'spread') works.
Each game a team plays, the bookmakers give us the expected margin between the two clubs. It’s perfect for this exercise because it’s literally doing much of the work for us:
Beat the line and you’ve performed to or beaten the expectation, fall short and you haven’t reached expectation.
This is a great start but all we’ll have here is a chart of coaches that have covered the line more often than others and this will trend towards parity so we need to dive deeper in the data.
Winning is the goal of the game
Ultimately, you want coaches winning, regardless of by how much.
We factor this in by not grading coaches too harshly if they’ve been heavy favourites with a big line, but have only just scraped over the point spread. This prevents successful coaches from slipping unreasonably down the Sackometer, even though they’re winning matches, because their team is already expected to be really good.
Length of coaching tenure
Another factor we’ve added to the algorithm is how long a coach has been in the role for.
For coaches who are new to a team, we dial down the 'pressure multipliers' (i.e. the variables that determine the pressure the coach may be under) to let them settle into their role. This increases each game they coach and by the time they’ve reached roughly 60 games with the same team, their ‘new coach’ factor has completely disappeared.
Finals performances
While some coaches are expected to feature heavily in the AFL Finals, others have exceeded expectations just by being there.
We view finals games in a similar way to home and away matches, but with some important differences.
If a team doesn't perform to 'expectation' during a final, and the coach's rating is deemed 'negative' for this match, we don’t punish them as harshly as we might have for a regular season result. On the flip side, if the coach's rating is positive, the coach receives a greater boost than they would expect normally.
This effect is more pronounced the deeper into the finals series the coach goes.
Team experience
The last variable that we’ve thrown into the mix is the average player experience (games played) of the team they were coaching that day, against the average playing experience of their opponent.
This factor can be important in working out what phase a team development or list build is currently at. The more experienced team across the park, the higher the expectation that it should win that game.
Conversely, the less experienced the team, the more we can assume that the expectation of winning is lower.
How to read the Sackometer
The score you see beside each coach on the AFL Sackometer is a scale of a zero sum equation, where zero means a coach is meeting the average expectation against his peers, and either under more or less pressure depending on how far from zero they are.
Every round, we track the movement of coaches on the Sackometer scale and display their ranking changes over the last five rounds (hover over or click on the numbers on the right-hand side of the table to view coach rank movement).
The AFL Sackometer is updated every Tuesday after each round with new information - see it in action here.
Drop a comment at the bottom of the page to participate in discussion with like-minded-sports-and-data-nerds 👇


